Copyright
©The Author(s) 2025.
World J Gastroenterol. Aug 21, 2025; 31(31): 109605
Published online Aug 21, 2025. doi: 10.3748/wjg.v31.i31.109605
Published online Aug 21, 2025. doi: 10.3748/wjg.v31.i31.109605
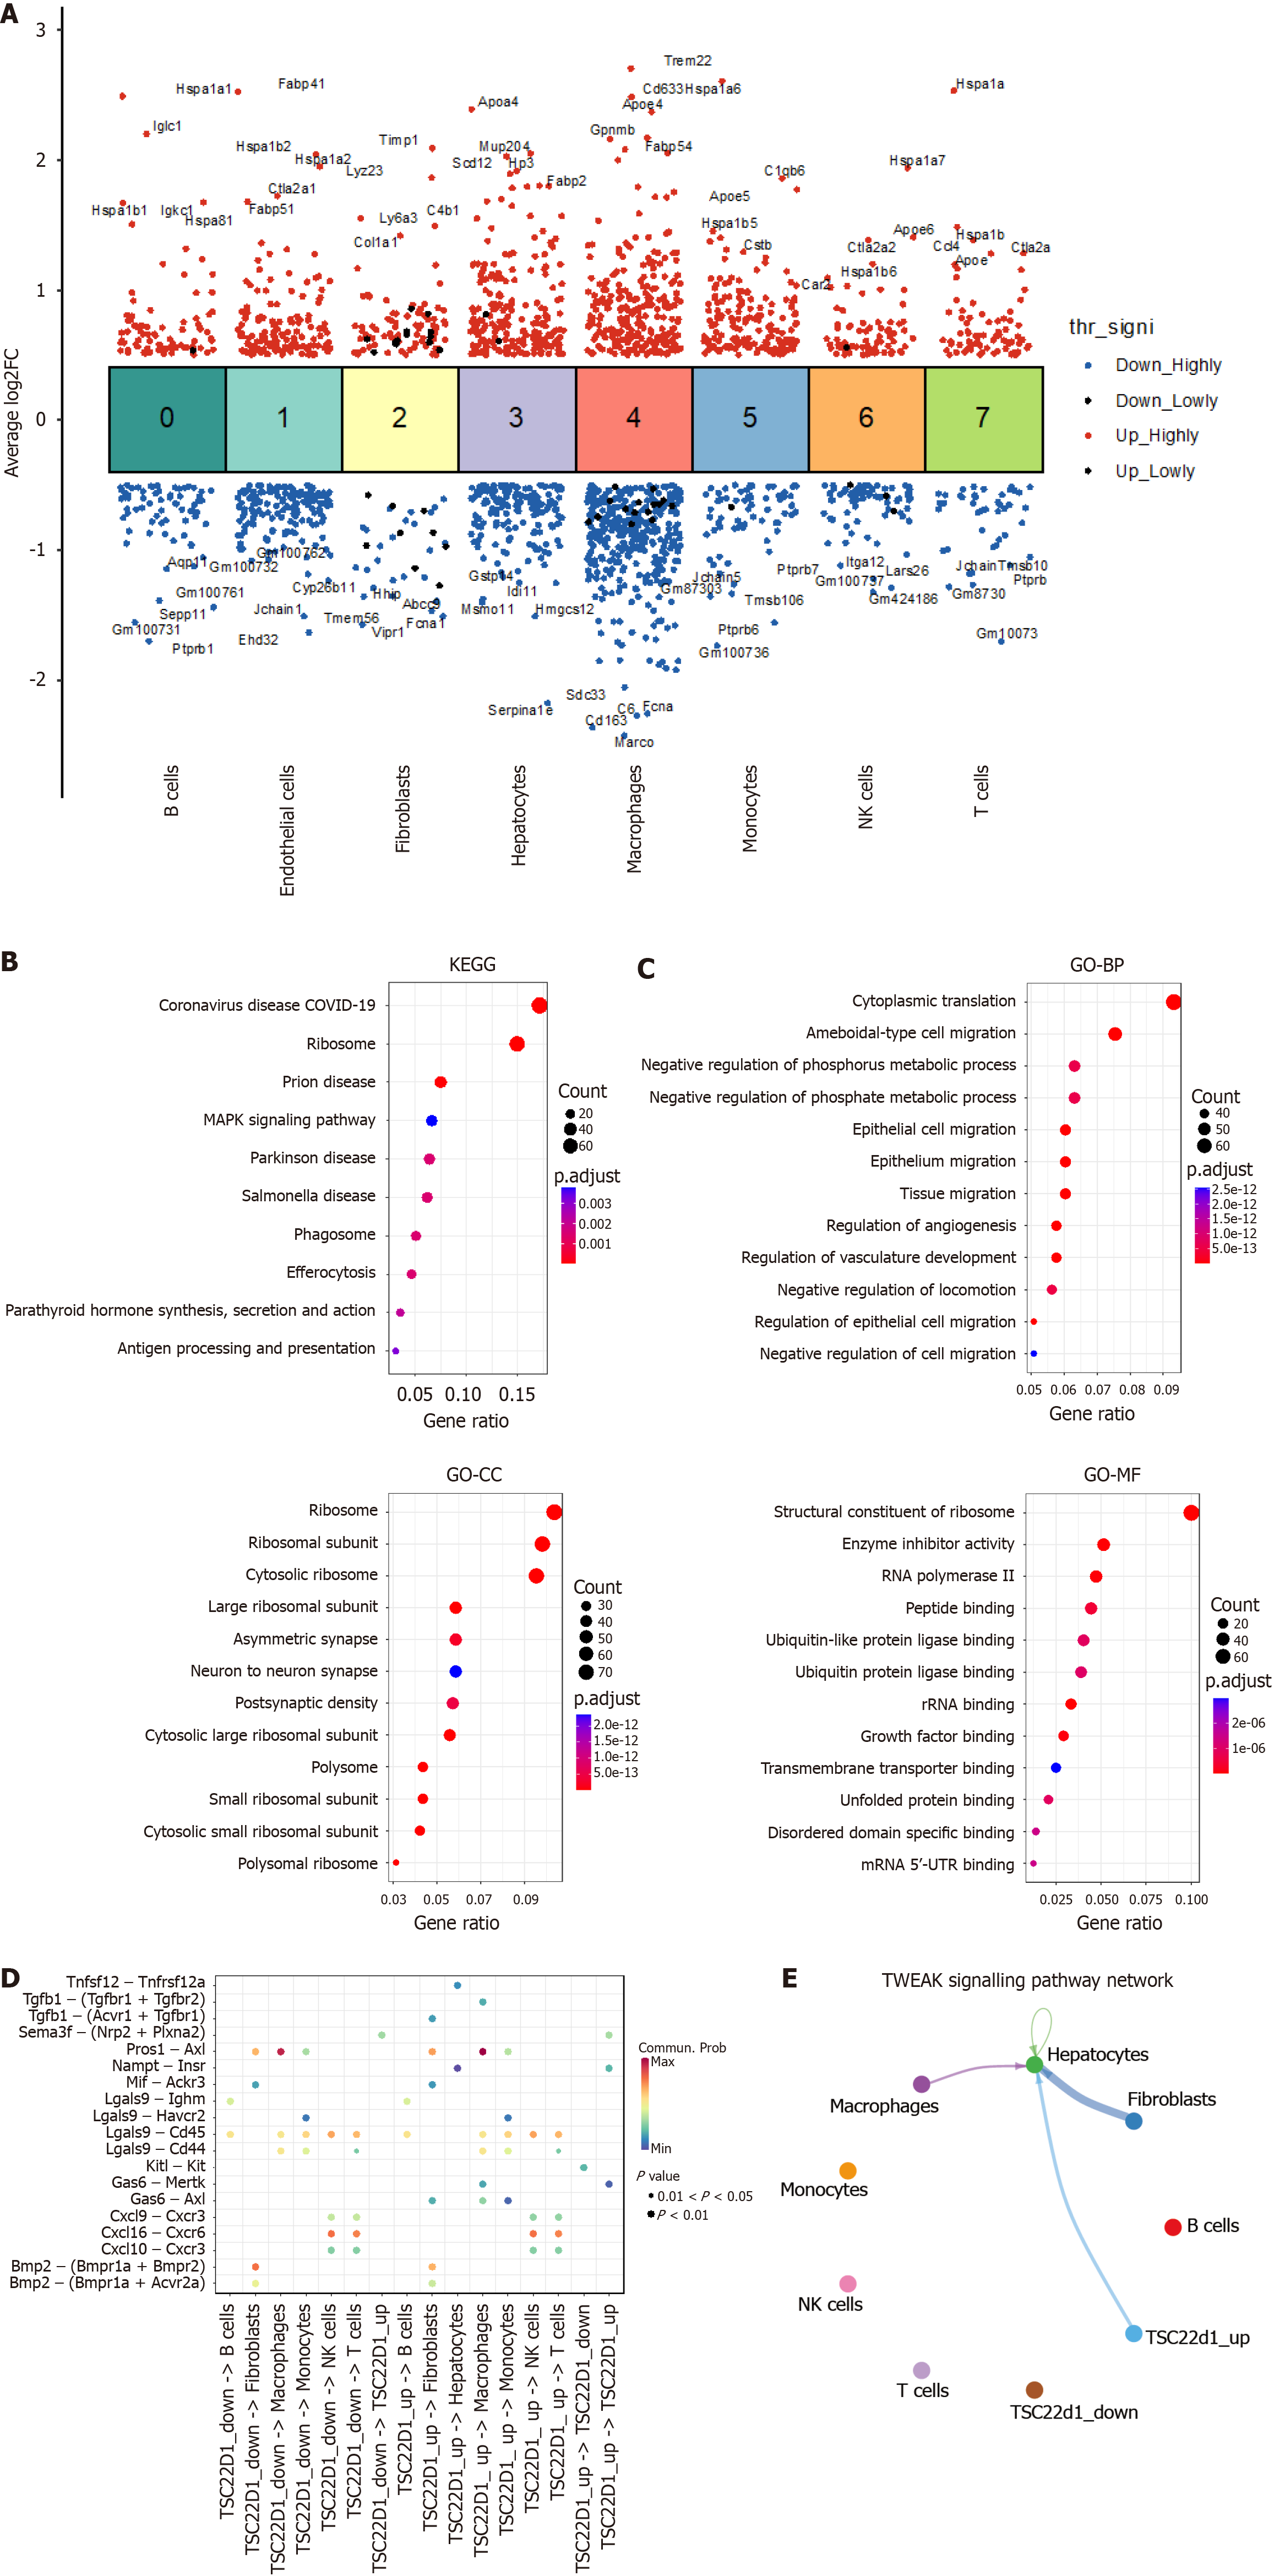
Figure 2 Cell communication analysis in nonalcoholic fatty liver disease.
A: Differential gene expression analysis showing up- and down-regulated genes across all eight clusters. An adjusted P value < 0.01 is indicated in red, while an adjusted P value ≥ 0.01 is indicated in black; B: Kyoto Encyclopedia of Genes and Genomes enrichment analysis of genetic variations in hepatic sinusoidal endothelial cells; C: Gene Ontology enrichment analysis of genetic variations in hepatic sinusoidal endothelial cells; D: Analysis of TSC22D1 expression levels in hepatic sinusoidal endothelial cells and the strength of communication with other cell types; E: Different cells interact via the tumor necrosis factor-like weak inducer of apoptosis fibroblast growth factor-inducible 14 signaling pathway. NK: Nature killer; FC: Fold change; COVID-19: Corona virus disease 2019; MAPK: Mitogen-activated protein kinase; KEGG: Kyoto Encyclopedia of Genes and Genomes; GO: Gene Ontology; BP: Biological process; CC: Cellular component; MF: Molecular function; 5’-UTR: 5’ untranslated region; mRNA: Message RNA.
- Citation: Ding W, Xu XQ, Wu LL, Wang Q, Wang YQ, Chen WW, Tan YL, Wang YB, Jiang HJ, Dong J, Yan YM, Xu XZ. TSC22D1 promotes liver sinusoidal endothelial cell dysfunction and induces macrophage M1 polarization in non-alcoholic fatty liver disease. World J Gastroenterol 2025; 31(31): 109605
- URL: https://www.wjgnet.com/1007-9327/full/v31/i31/109605.htm
- DOI: https://dx.doi.org/10.3748/wjg.v31.i31.109605


