Copyright
©The Author(s) 2025.
World J Gastroenterol. Aug 21, 2025; 31(31): 109605
Published online Aug 21, 2025. doi: 10.3748/wjg.v31.i31.109605
Published online Aug 21, 2025. doi: 10.3748/wjg.v31.i31.109605
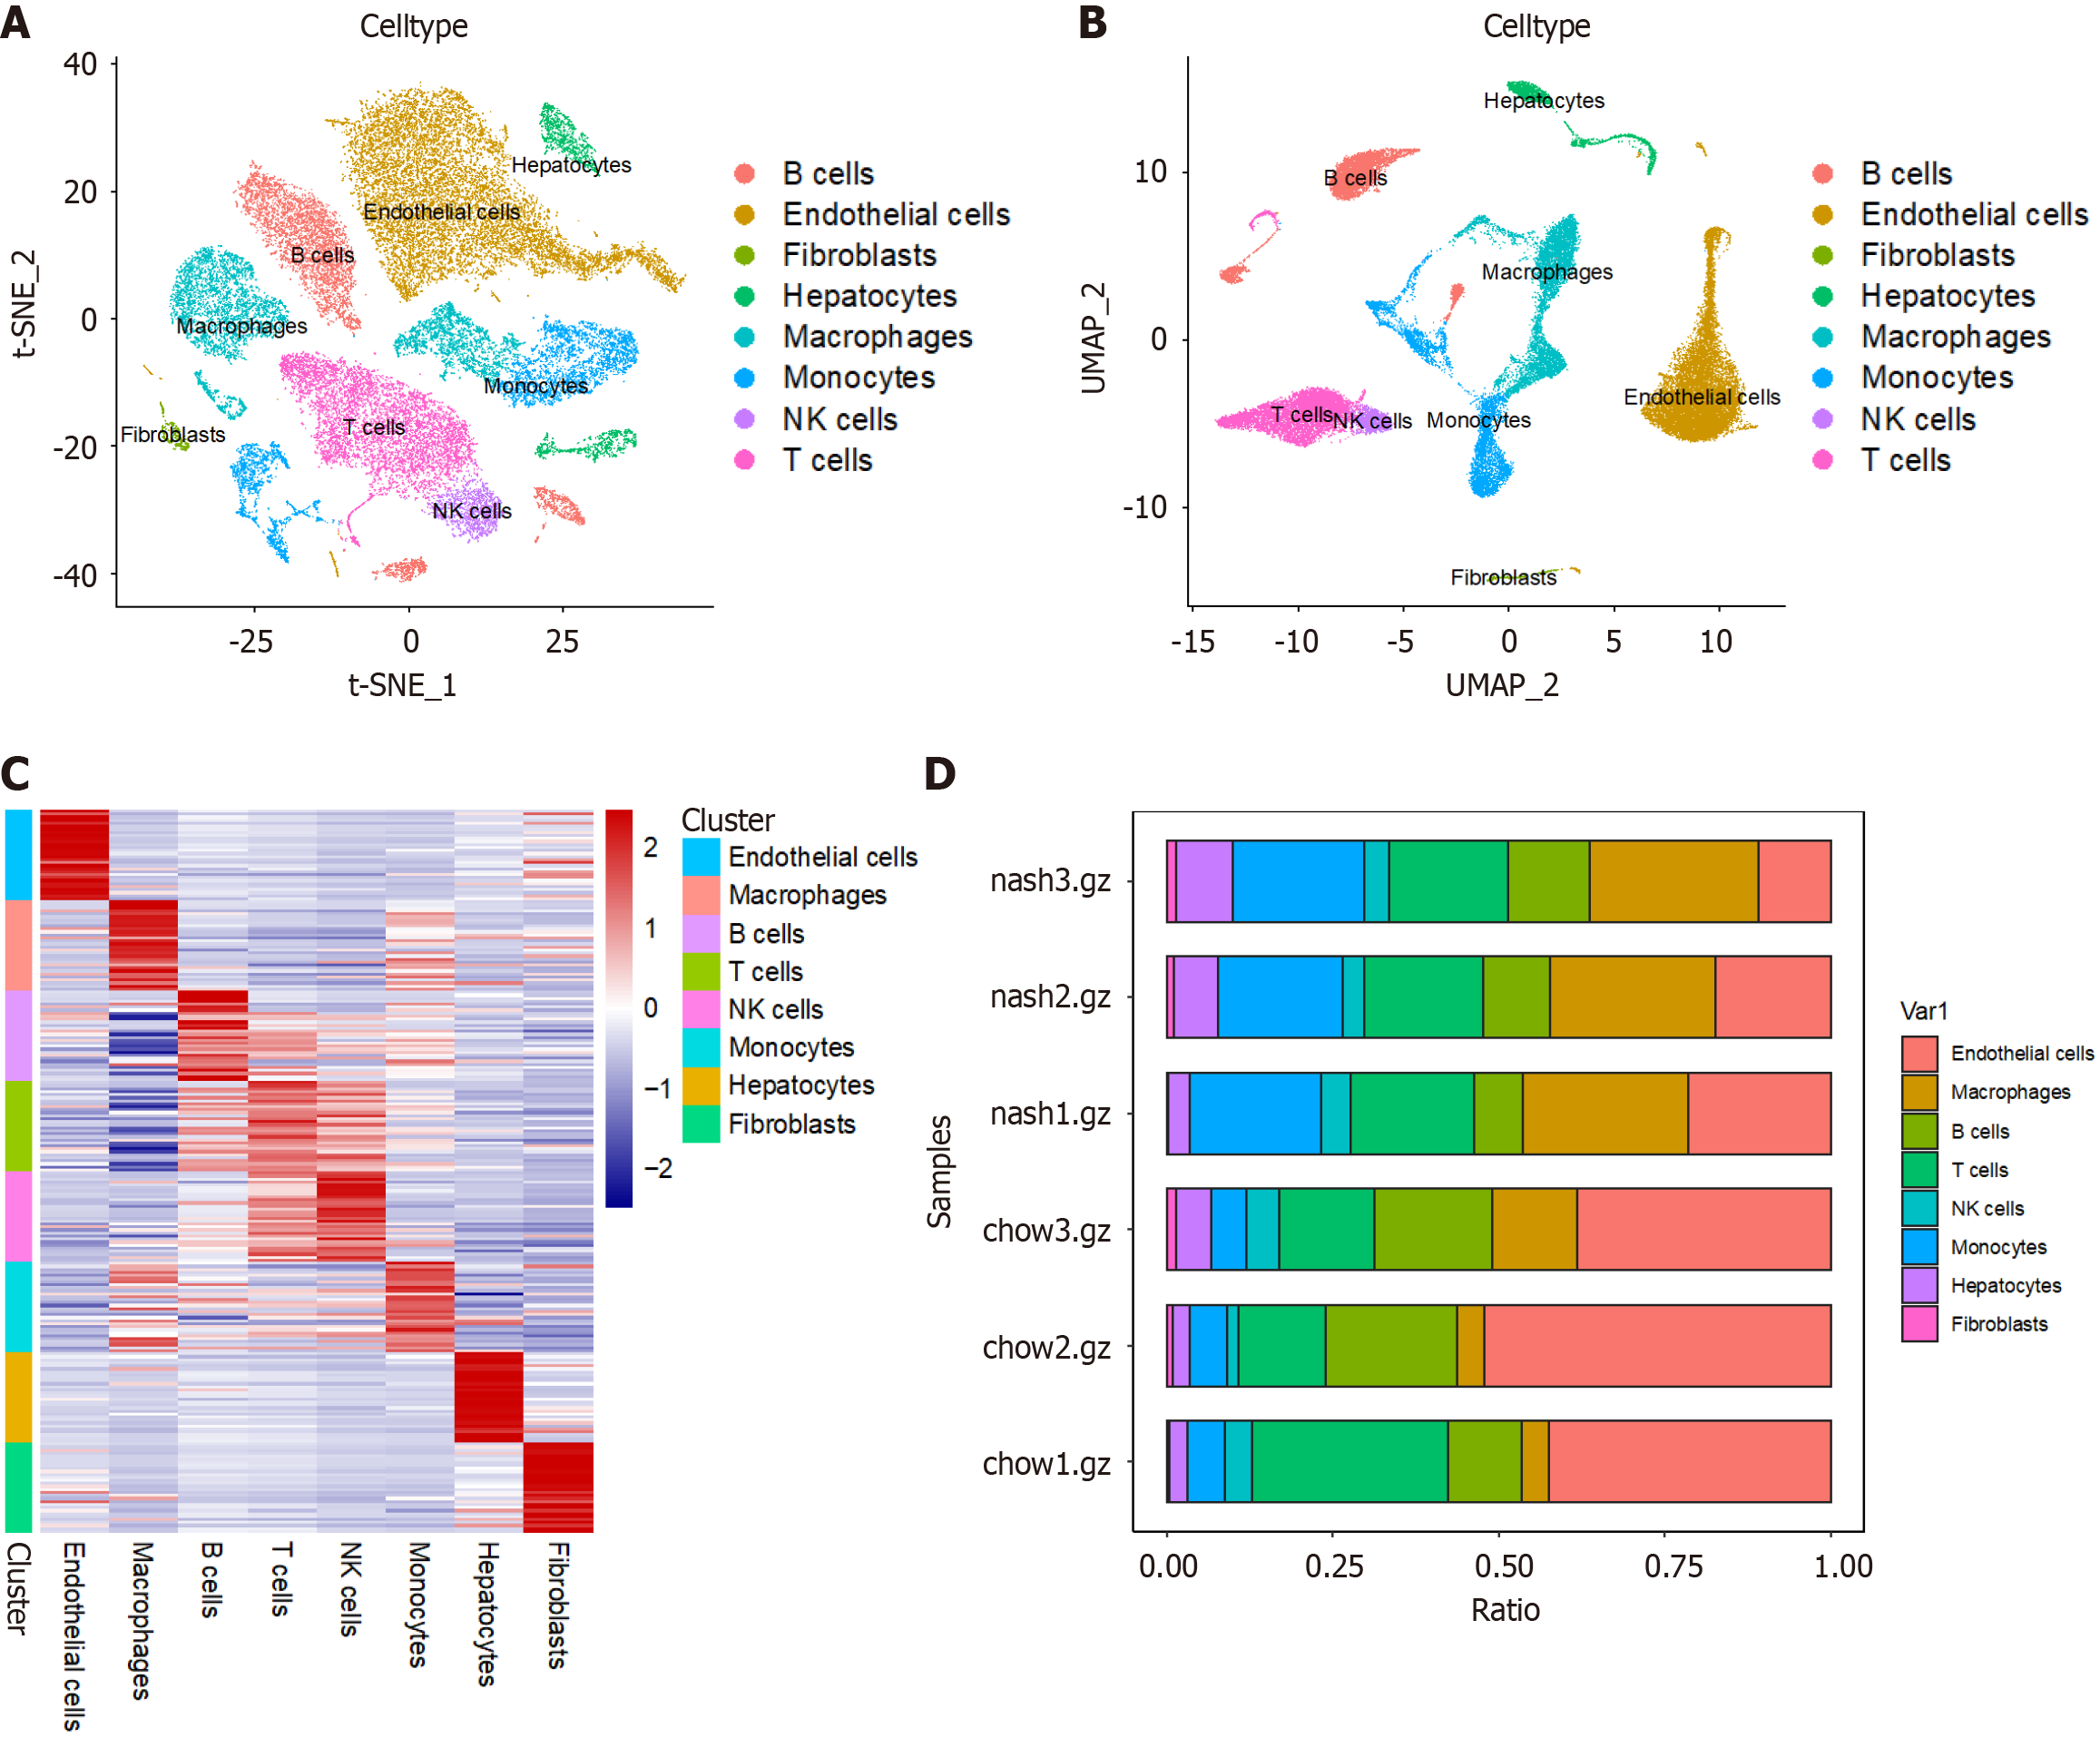
Figure 1 Single-cell atlas of liver tissue from two groups of mice.
A: T-distributed stochastic neighbor embedding plot of single cells from liver tissue of two groups of mice; B: Uniform manifold approximation plot of single cells from liver tissue of two groups of mice; C: Heatmap of characteristic genes of various cell types in liver tissue; D: Cell proportion plot in each sample. t-SNE: T-distributed stochastic neighbor embedding; UMAP: Uniform manifold approximation; NK: Nature killer.
- Citation: Ding W, Xu XQ, Wu LL, Wang Q, Wang YQ, Chen WW, Tan YL, Wang YB, Jiang HJ, Dong J, Yan YM, Xu XZ. TSC22D1 promotes liver sinusoidal endothelial cell dysfunction and induces macrophage M1 polarization in non-alcoholic fatty liver disease. World J Gastroenterol 2025; 31(31): 109605
- URL: https://www.wjgnet.com/1007-9327/full/v31/i31/109605.htm
- DOI: https://dx.doi.org/10.3748/wjg.v31.i31.109605


