Copyright
©The Author(s) 2025.
World J Gastroenterol. Aug 21, 2025; 31(31): 108977
Published online Aug 21, 2025. doi: 10.3748/wjg.v31.i31.108977
Published online Aug 21, 2025. doi: 10.3748/wjg.v31.i31.108977
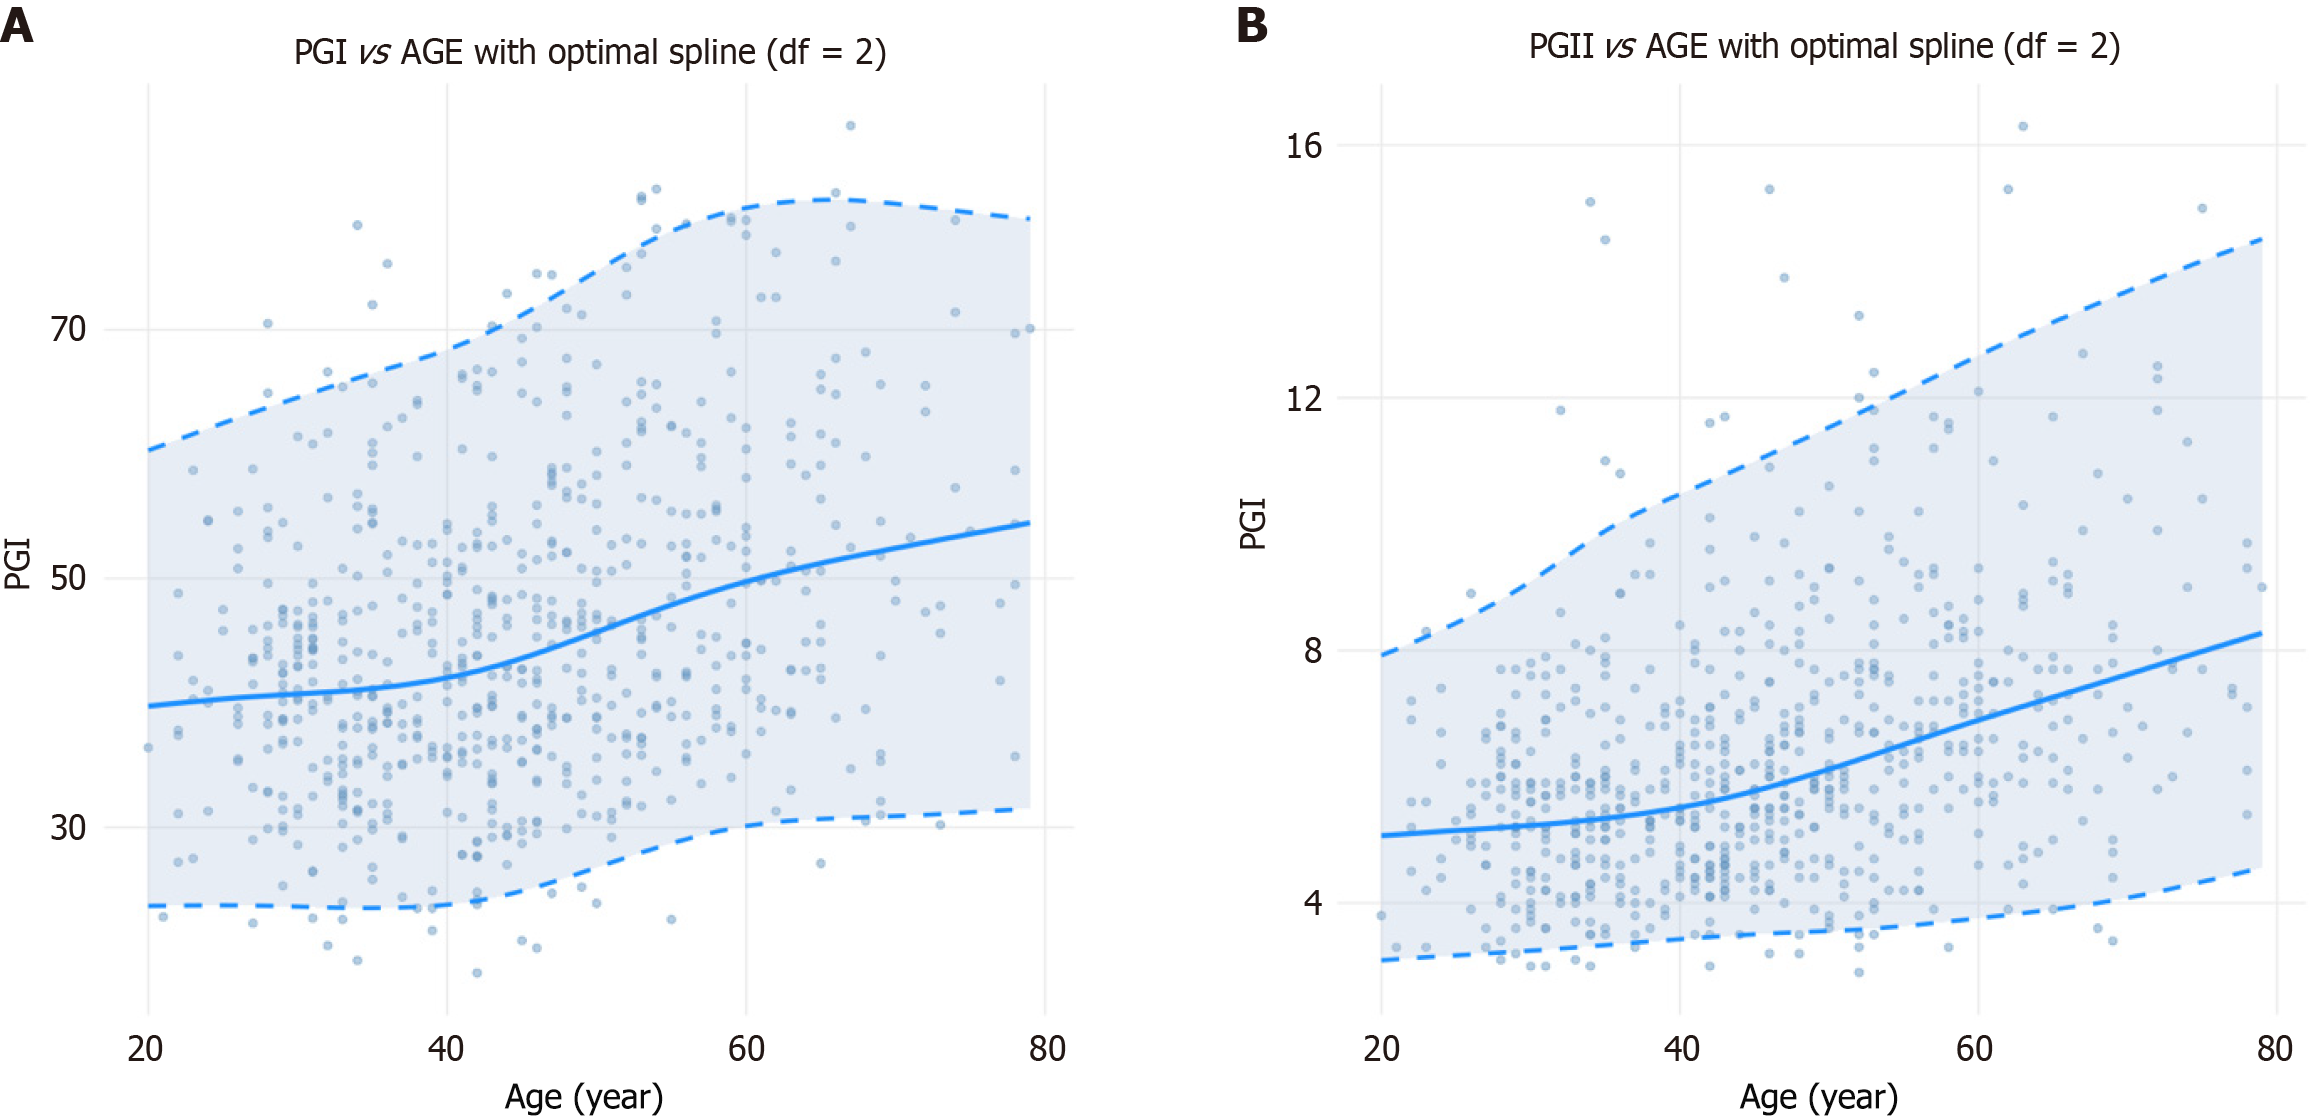
Figure 3 Next-generation reference intervals for pepsinogen I and pepsinogen II.
A and B: The figure illustrates age-related trends and next-generation reference intervals (RIs) for (A) pepsinogen (PG) I and (B) PG II, derived using generalized additive models for location, scale, and shape. A: For PG I, the solid line denotes the age-dependent medians (50th percentiles), showing the central tendency across age. Dashed lines depict the continuous 2.5th and 97.5th percentiles, corresponding to the lower and upper reference limits of the next-generation RIs, respectively; B: For PG II, the solid blue lines of the 50th percentiles show the age-dependent central trend. Dashed lines correspond to the continuous 2.5th and 97.5th percentiles, defining the lower and upper reference limits, respectively. These continuous reference percentiles provide a refined framework for interpreting biomarker values. PG: Pepsinogen; RIs: Reference intervals.
- Citation: Zhang MM, Zhu D, Zhao HB, Zhao XY. Age- and gender-specific dynamics and next-generation reference intervals for pepsinogen in northern China. World J Gastroenterol 2025; 31(31): 108977
- URL: https://www.wjgnet.com/1007-9327/full/v31/i31/108977.htm
- DOI: https://dx.doi.org/10.3748/wjg.v31.i31.108977


