Copyright
©The Author(s) 2025.
World J Gastroenterol. Aug 14, 2025; 31(30): 110112
Published online Aug 14, 2025. doi: 10.3748/wjg.v31.i30.110112
Published online Aug 14, 2025. doi: 10.3748/wjg.v31.i30.110112
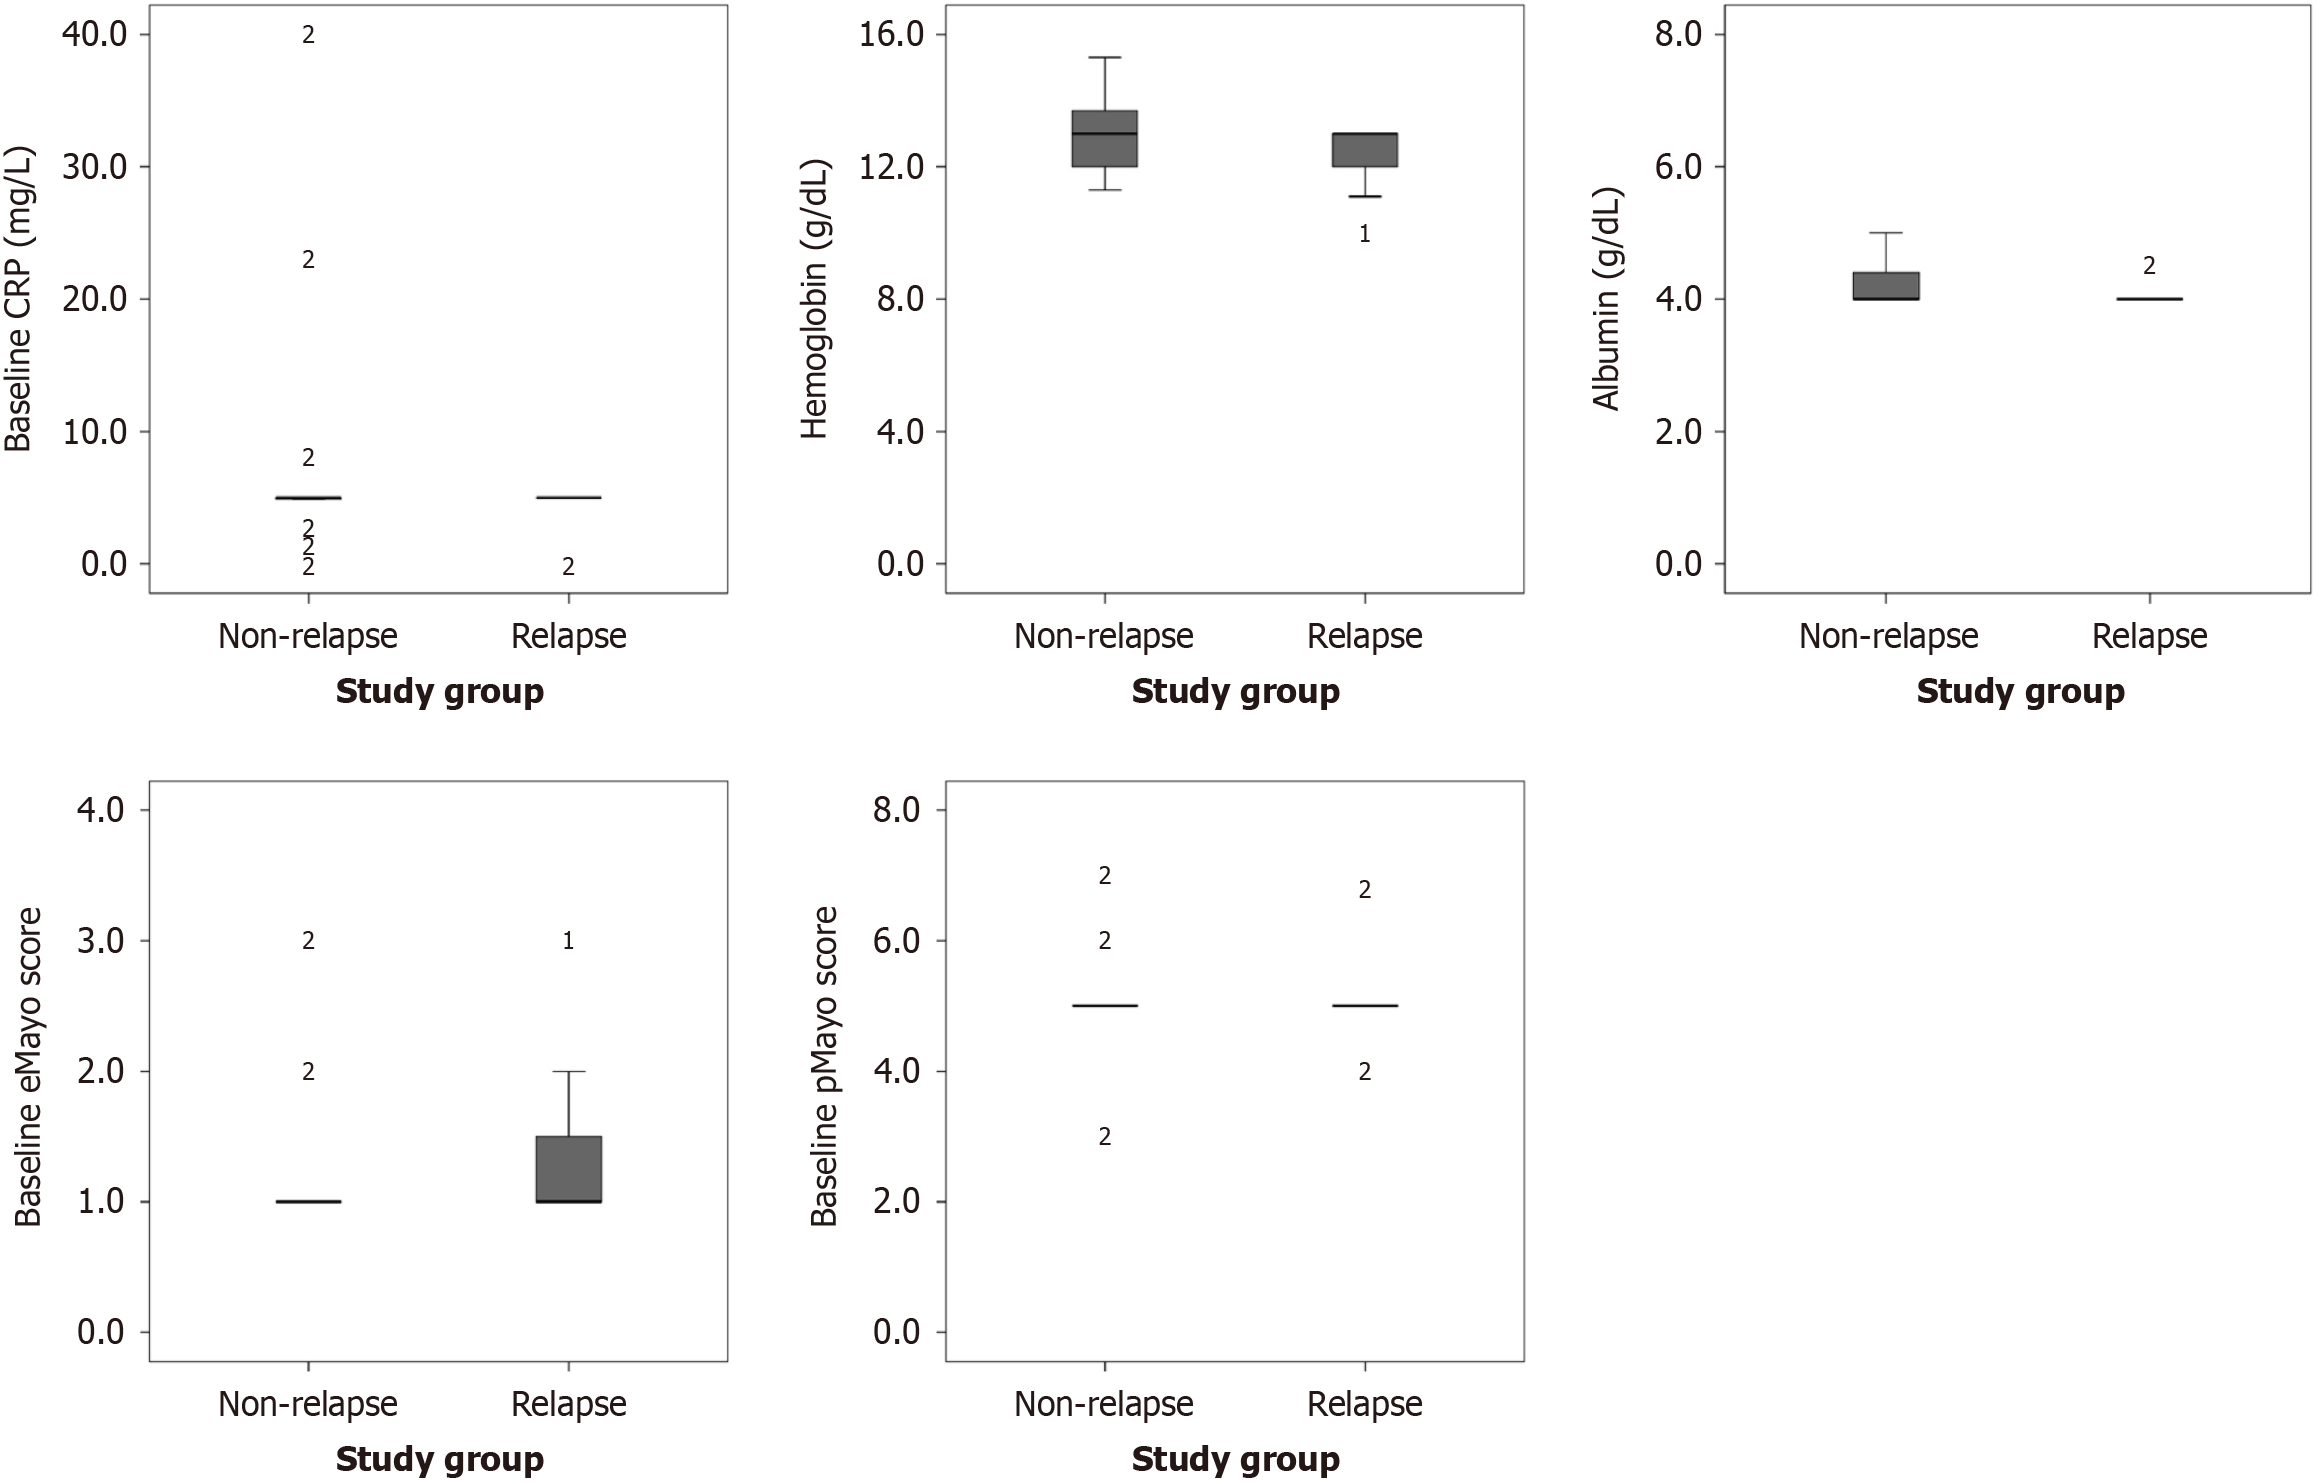
Figure 2 Boxplots comparing baseline inflammatory markers and activity scores between relapse and non-relapse groups.
The horizontal line within each box indicates the median, the box edges represent the interquartile range (IQR), and whiskers extend to 1.5 × IQR. Mild outliers (values beyond 1.5 × IQR), while extreme outliers (values beyond 3 × IQR). 1Mild outliers (values beyond 1.5 × IQR). 2Extreme outliers (values beyond 3 × IQR). CRP: C-reactive protein; eMayo: Endoscopic Mayo subscore; pMayo: Partial Mayo score.
- Citation: Atay A, Ergul M, Ozturk O, Acun KC, Cagir Y, Durak MB, Yuksel I. Outcomes of 5-aminosalicylates withdrawal due to non-adherence in ulcerative colitis patients: A step toward evaluating intermittent therapy. World J Gastroenterol 2025; 31(30): 110112
- URL: https://www.wjgnet.com/1007-9327/full/v31/i30/110112.htm
- DOI: https://dx.doi.org/10.3748/wjg.v31.i30.110112


