Copyright
©The Author(s) 2025.
World J Gastroenterol. Aug 14, 2025; 31(30): 109863
Published online Aug 14, 2025. doi: 10.3748/wjg.v31.i30.109863
Published online Aug 14, 2025. doi: 10.3748/wjg.v31.i30.109863
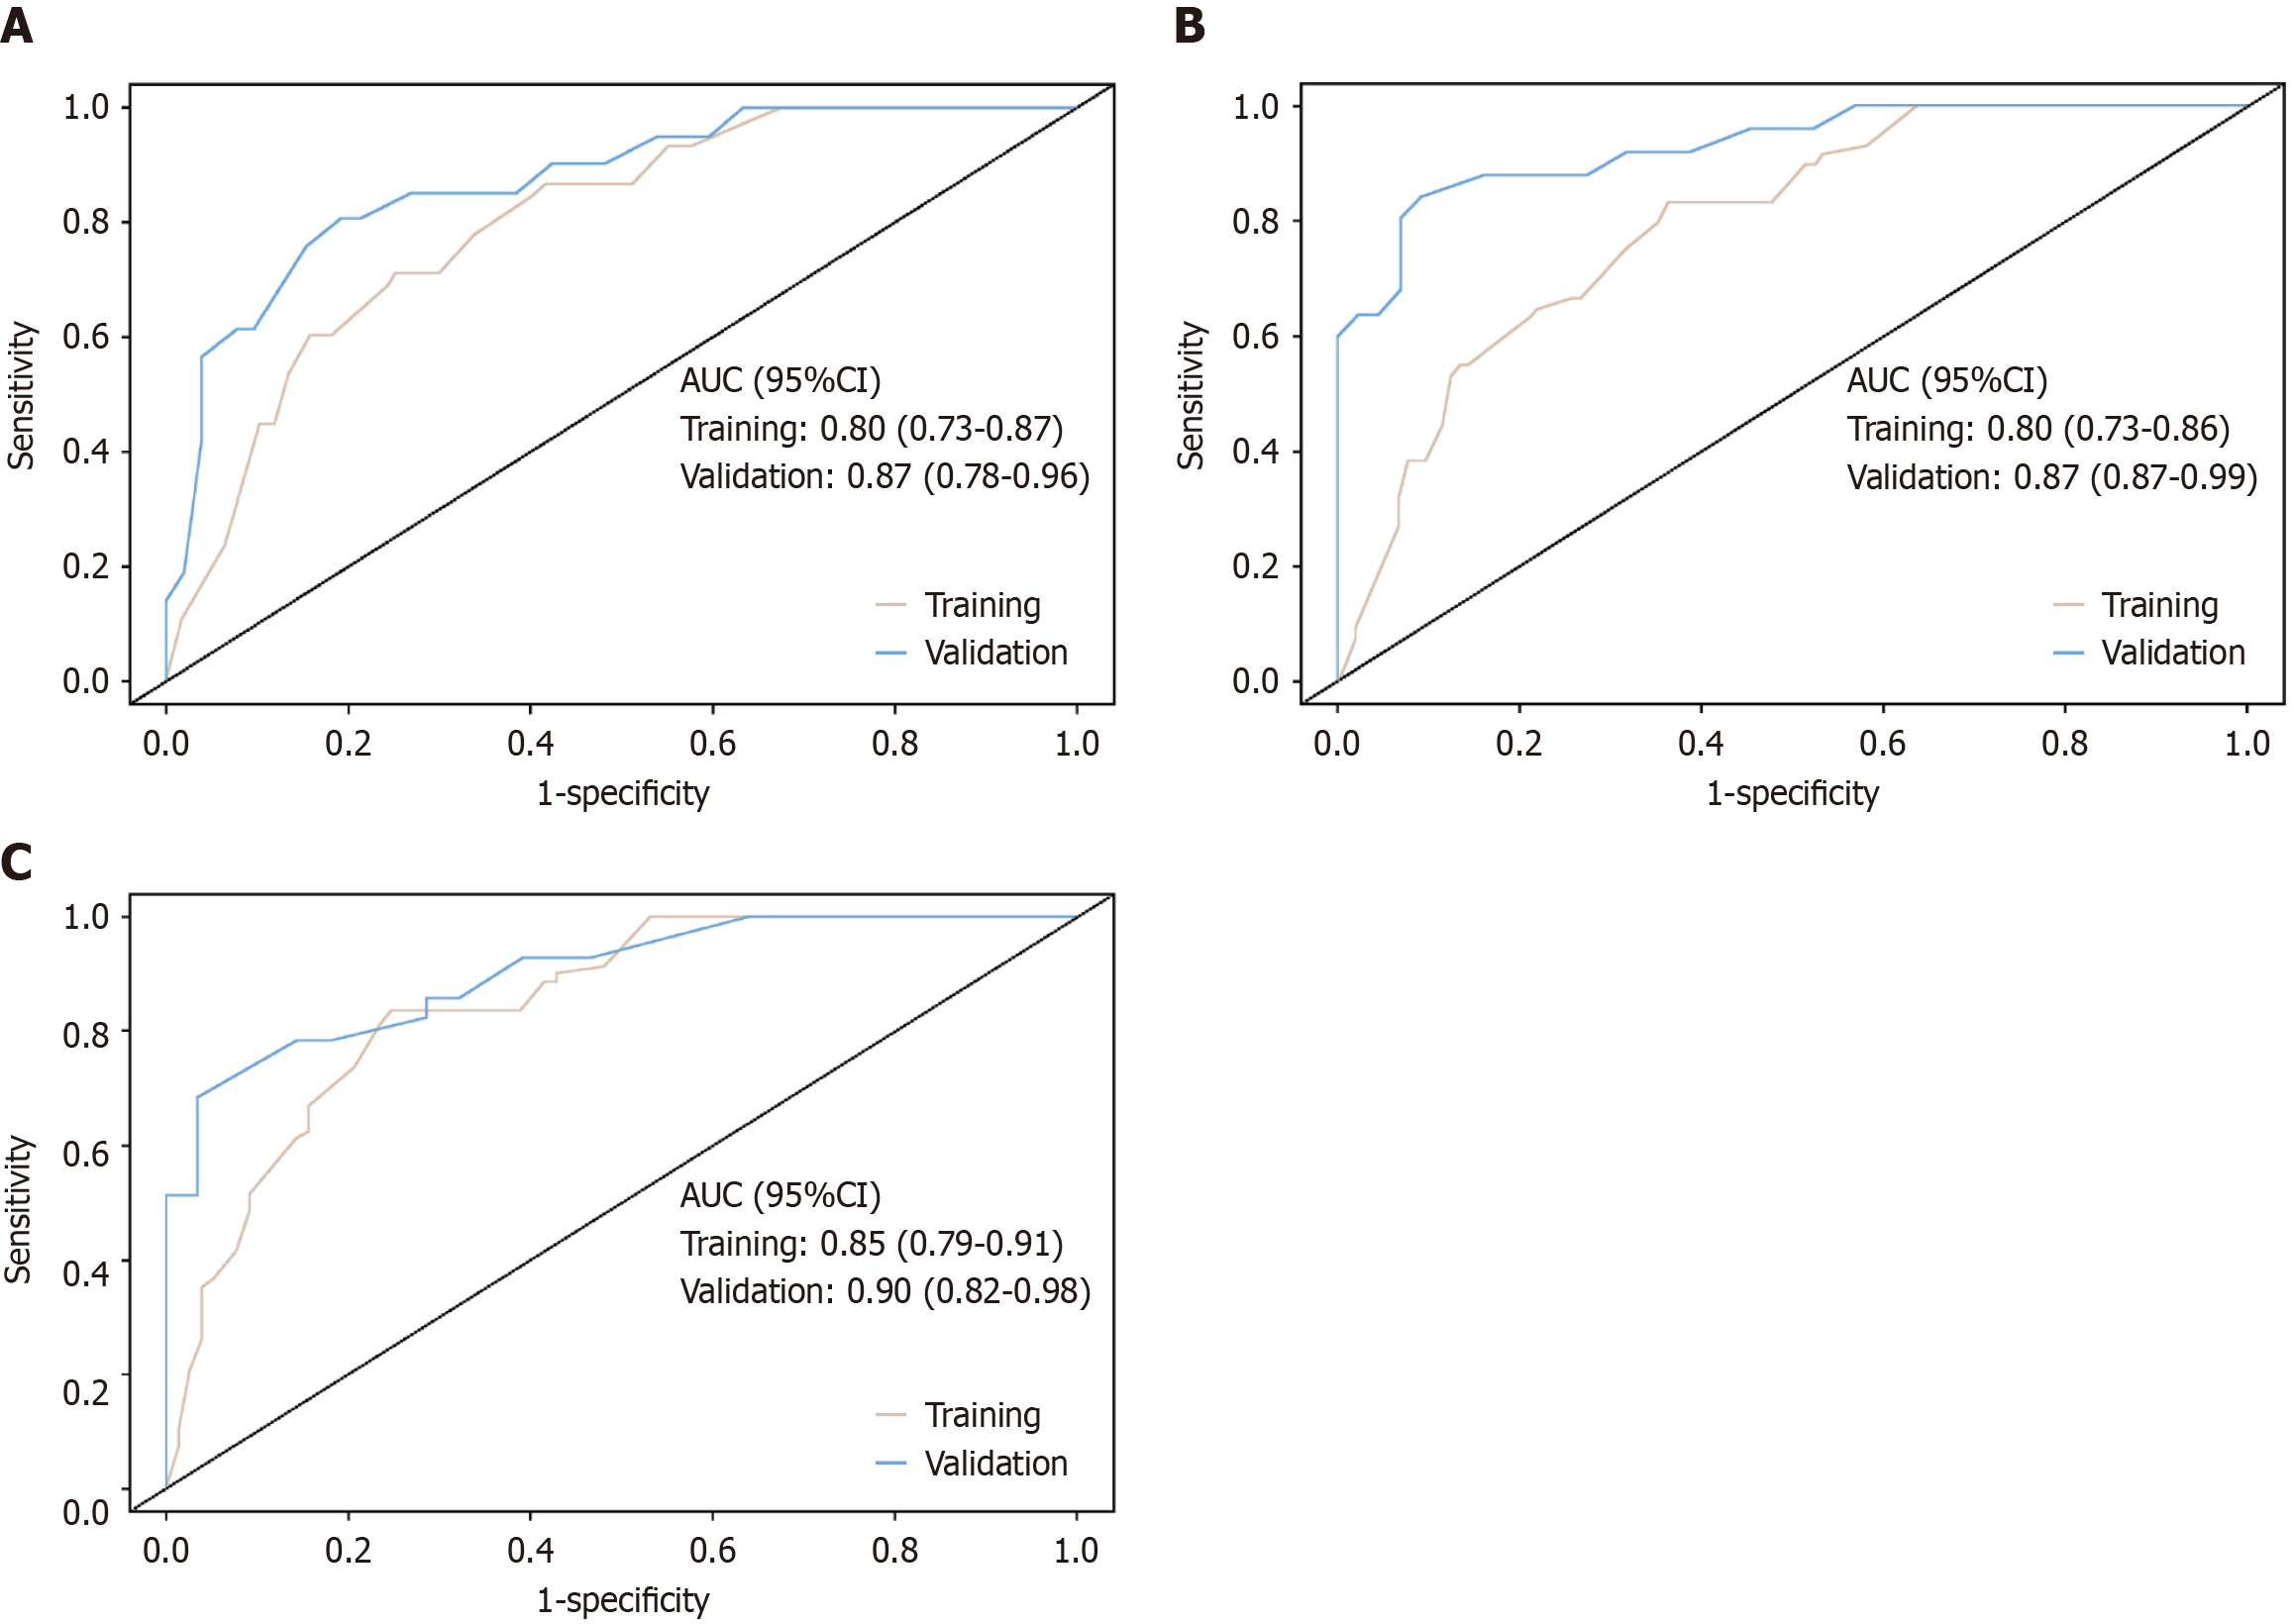
Figure 4 Graph depicting the operating characteristic evaluation plot for a prognostic model.
A: Graph showing the training set and validation set receiver operating characteristic (ROC) evaluation plots for 12-month prognostic prediction model; B: Graph showing the training set and validation set ROC evaluation plots for 15-month prognostic prediction model; C: Graph showing the training set and validation set ROC evaluation plots for 18-month prognostic prediction model. AUC: Area under the curve; CI: Confidence interval.
- Citation: Li GC, Yao ZY, Mao HS, Han ZX. Association of triglyceride-glucose index with long-term prognosis in advanced hepatocellular carcinoma patients receiving immunotherapy and targeted therapy. World J Gastroenterol 2025; 31(30): 109863
- URL: https://www.wjgnet.com/1007-9327/full/v31/i30/109863.htm
- DOI: https://dx.doi.org/10.3748/wjg.v31.i30.109863


