Copyright
©The Author(s) 2025.
World J Gastroenterol. Aug 7, 2025; 31(29): 106895
Published online Aug 7, 2025. doi: 10.3748/wjg.v31.i29.106895
Published online Aug 7, 2025. doi: 10.3748/wjg.v31.i29.106895
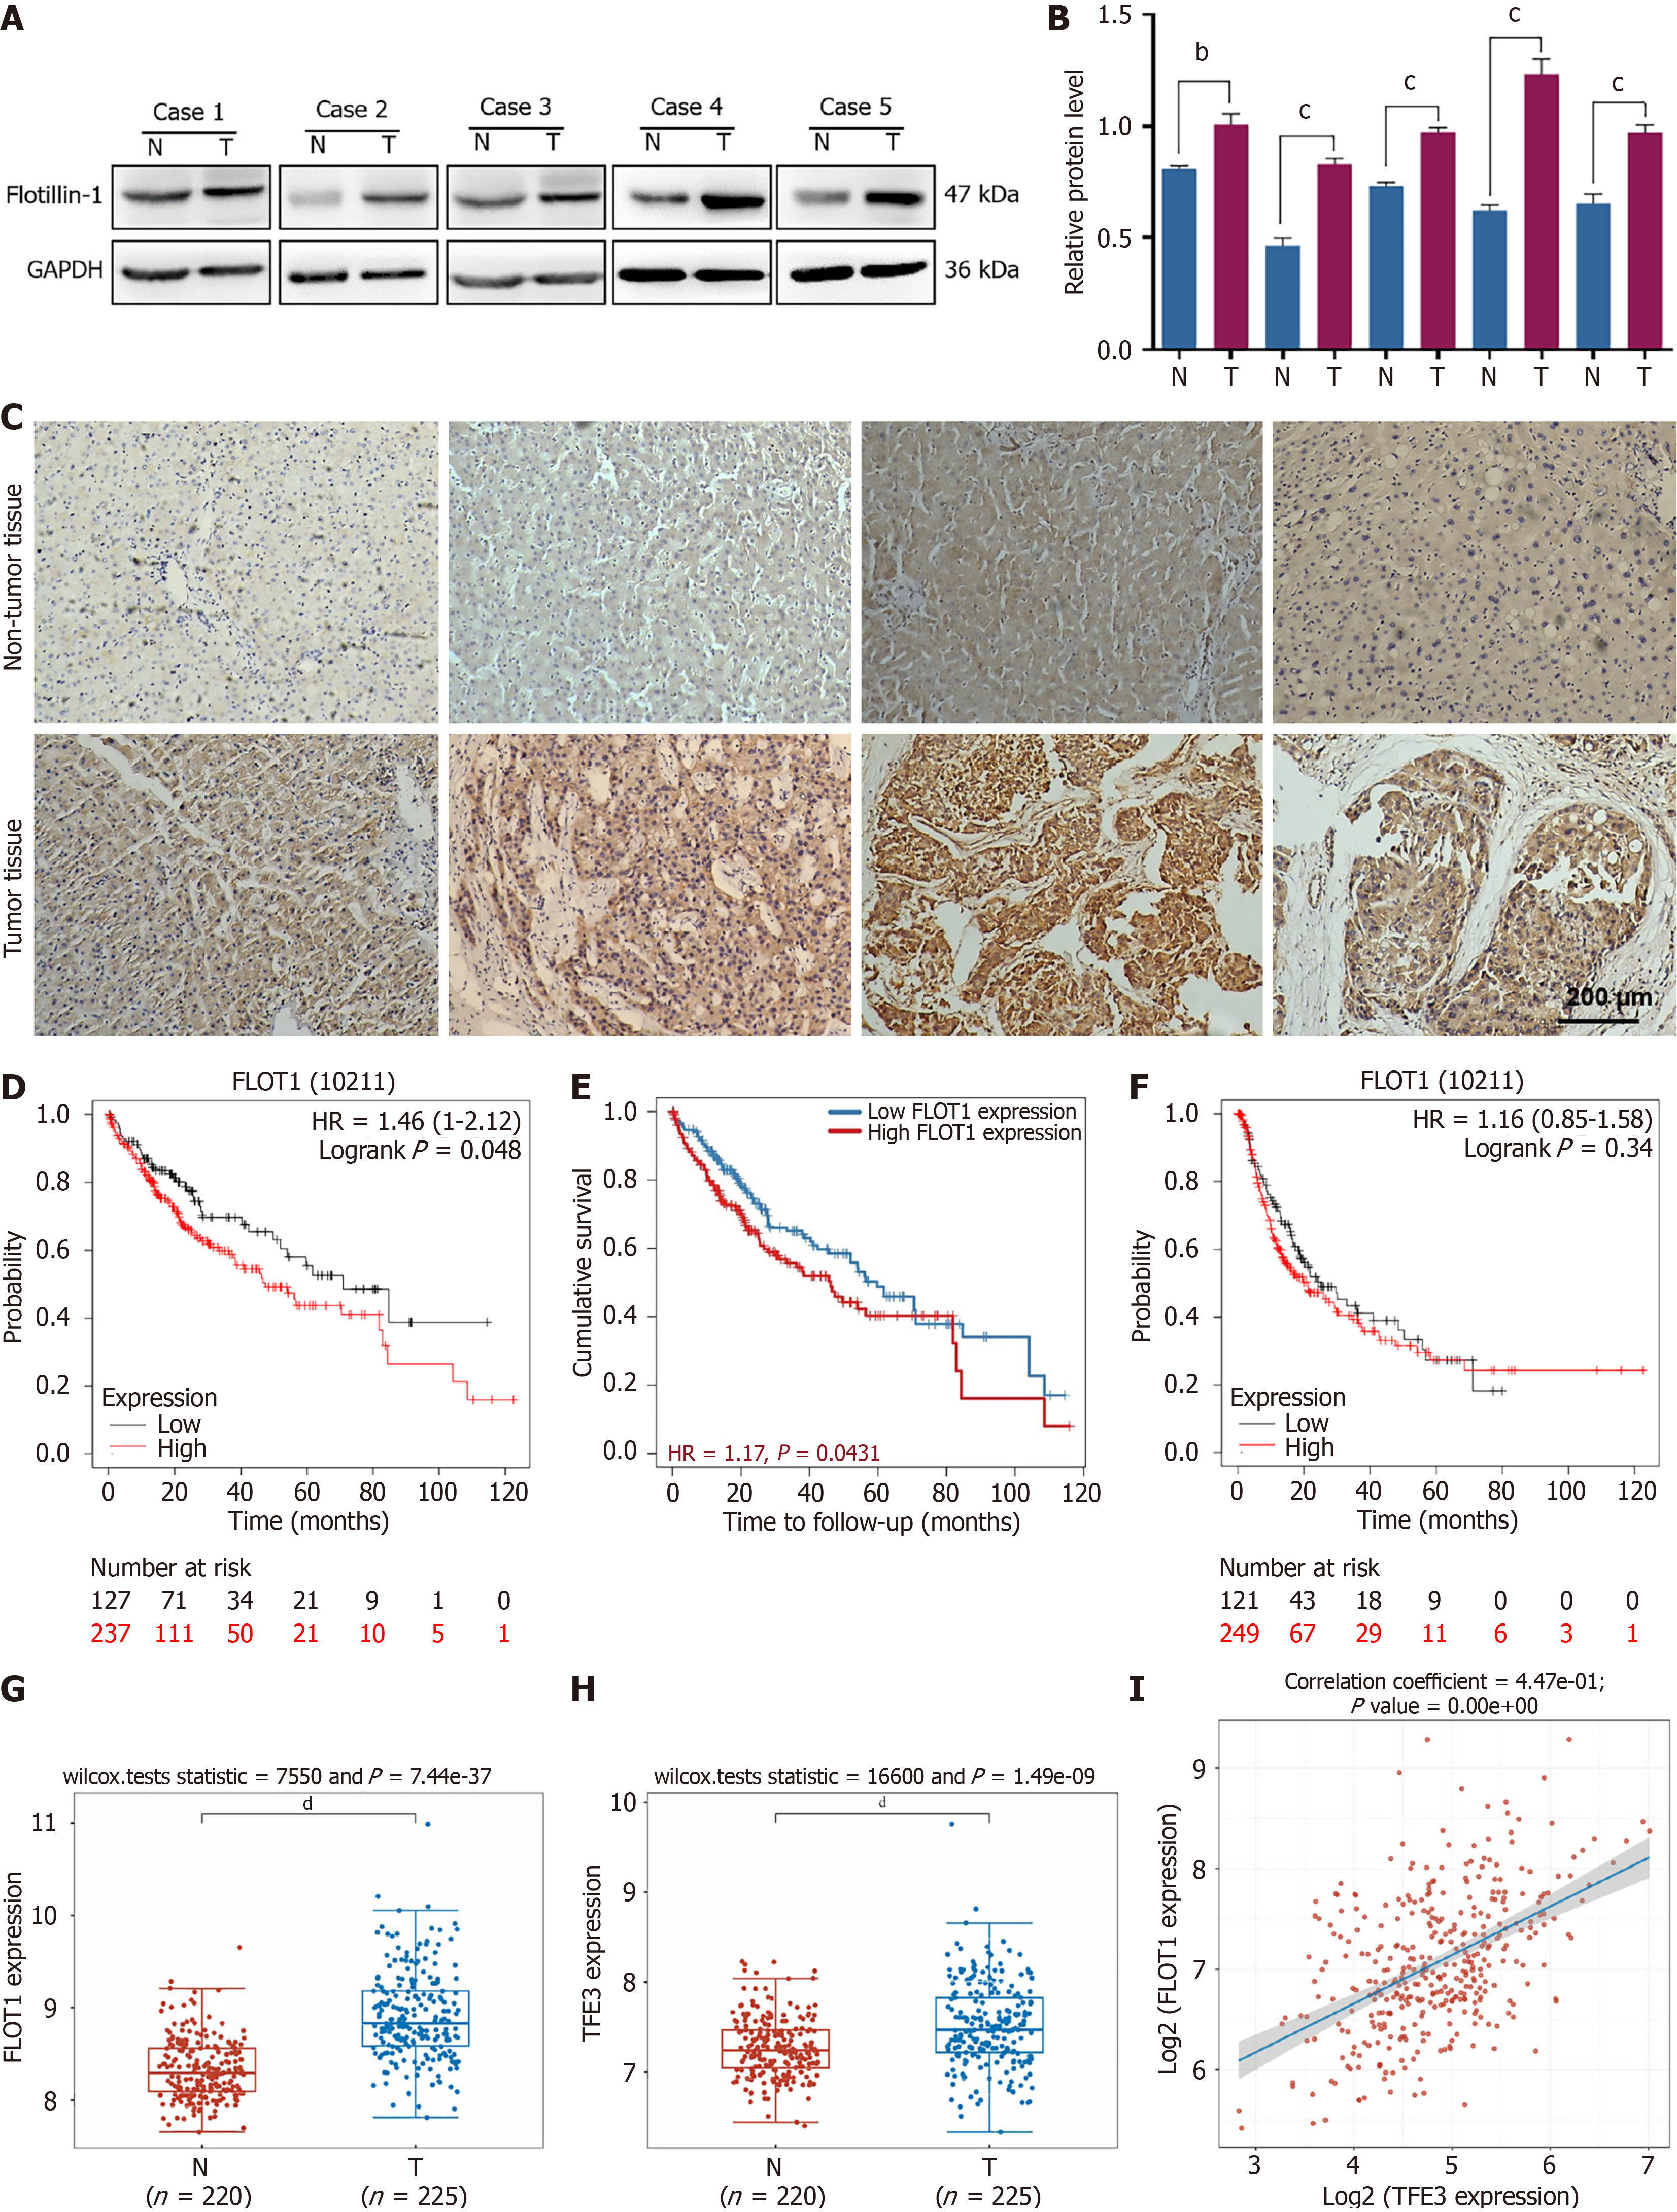
Figure 1 Correlation analysis of flotillin-1 expression and prognosis of liver cancer.
A and B: Western blot and semi-quantitative analysis of the expression of flotillin-1 (FLOT1) in hepatocellular carcinoma (HCC) and adjacent normal tissues with GAPDH as a reference. Values are expressed as mean ± SD (n = 5); C: Immunohistochemical staining analysis of FLOT1 in HCC and adjacent normal tissues. Correlation analysis between FLOT1 expression and prognostic survival in HCC patients via Kaplan-Meier plotter analysis; D: Overall survival; E: Tumor Immune Estimating Resource analysis; F: Progression-free survival; G and H: Expression distribution of the FLOT1 gene and transcription factor E3 gene in tumor tissues and normal tissues; I: Scatter plot and fitting line of Spearman correlation analysis between gene and gene expression. Each point in the figure represents a sample; the X-axis and Y-axis represent gene expression. Comparisons between the two groups were performed using the t-test. bP < 0.01, cP < 0.001, dP < 0.0001. FLOT1: Flotillin-1; HR: Hazard ratio; TFE3: Transcription factor E3.
- Citation: Zhang L, Bai CZ, Shan JY, Xue HL, Zheng SM, Chen YL, Tang SH. Flotillin-1 promotes the progression of hepatocellular carcinoma by activating TFE3-mediated Golgi stress response via inhibition of mTORC1/2. World J Gastroenterol 2025; 31(29): 106895
- URL: https://www.wjgnet.com/1007-9327/full/v31/i29/106895.htm
- DOI: https://dx.doi.org/10.3748/wjg.v31.i29.106895


