Copyright
©The Author(s) 2025.
World J Gastroenterol. Jul 21, 2025; 31(27): 108200
Published online Jul 21, 2025. doi: 10.3748/wjg.v31.i27.108200
Published online Jul 21, 2025. doi: 10.3748/wjg.v31.i27.108200
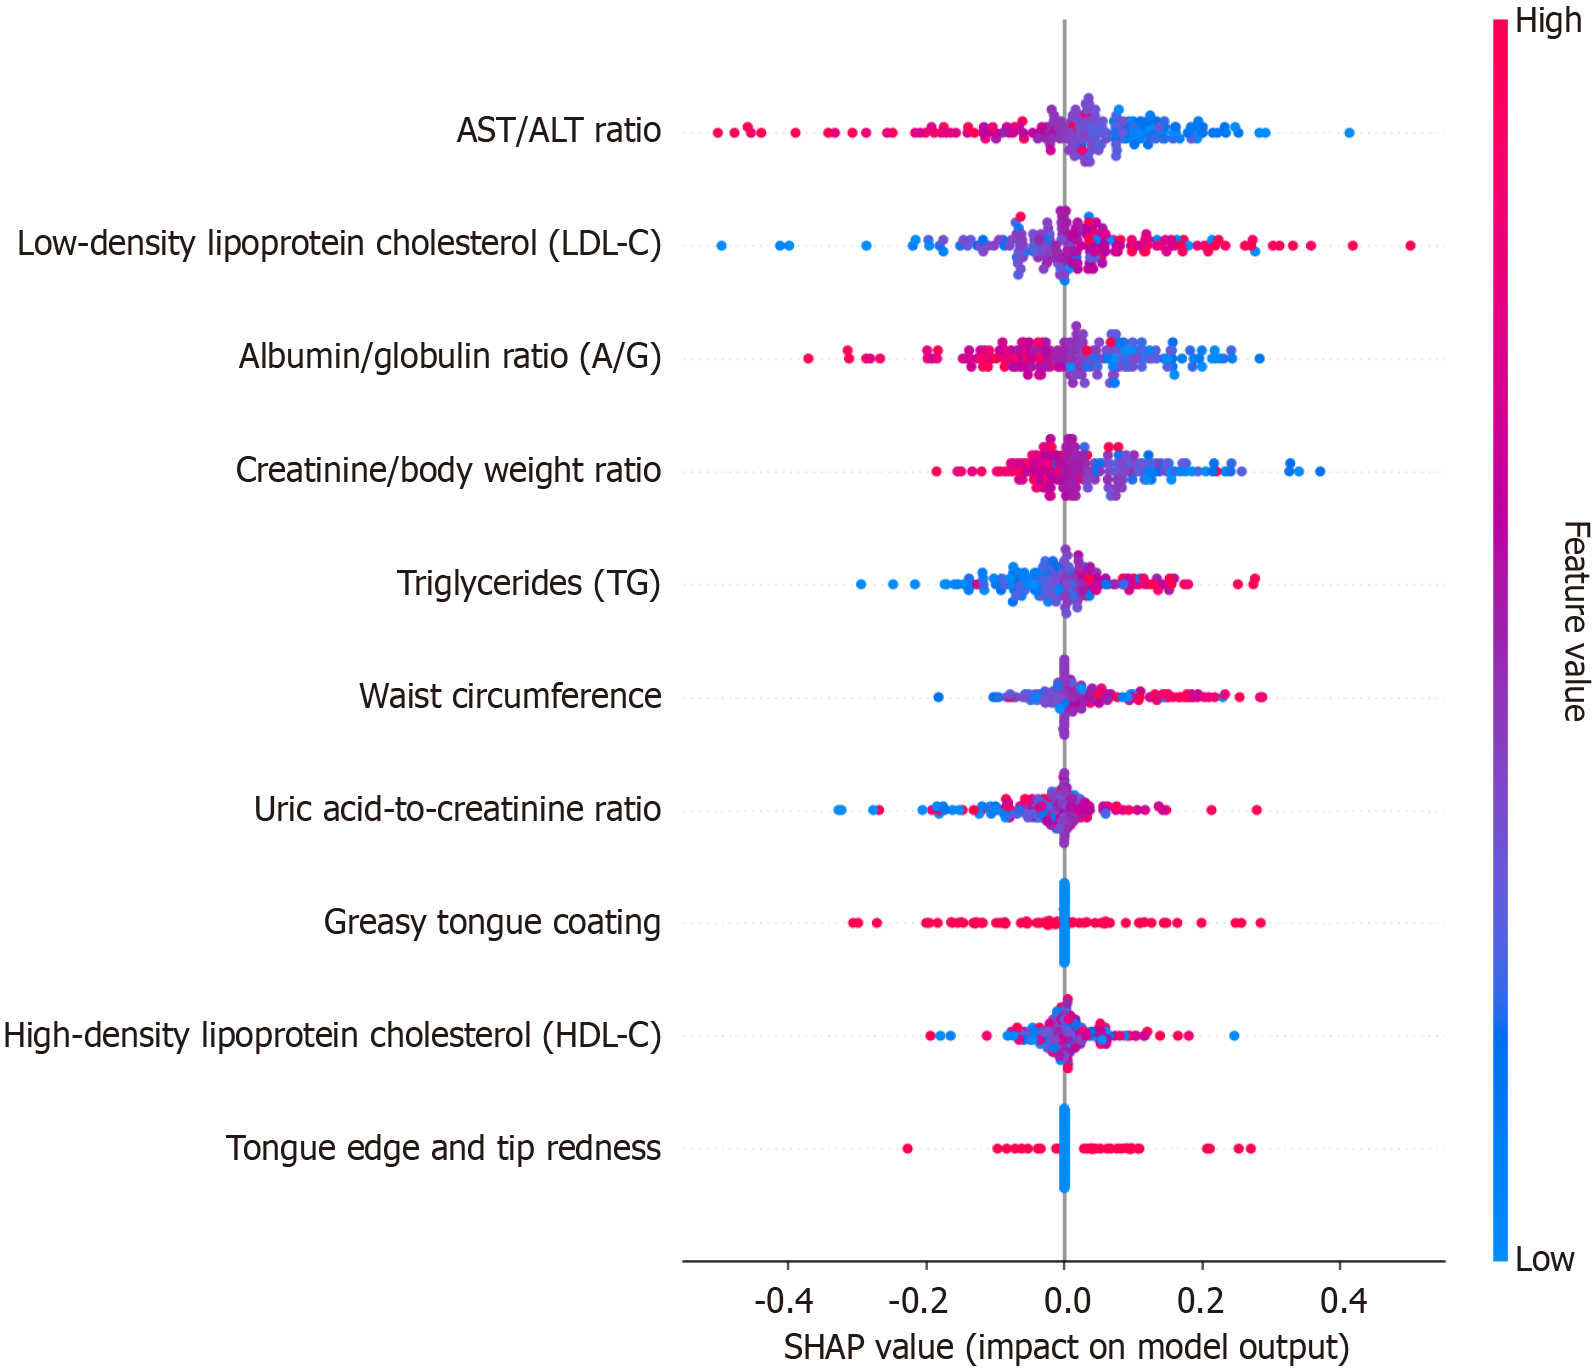
Figure 5 SHAP summary dot plot.
The probability of metabolic-associated fatty liver disease development increases with the SHAP value of a feature. A dot is made for SHAP value in the model for each single patient, so each patient has one dot on the line for each feature. ALT: Alanine aminotransferase; AST: Aspartate aminotransferase; HDL-C: High-density lipoprotein cholesterol; LDL-C: Low-density lipoprotein cholesterol; TG: Triglyceride; A/G: Albumin/globulin.
- Citation: Tian Y, Zhou HY, Liu ML, Ruan Y, Yan ZX, Hu XH, Du J. Machine learning-based identification of biochemical markers to predict hepatic steatosis in patients at high metabolic risk. World J Gastroenterol 2025; 31(27): 108200
- URL: https://www.wjgnet.com/1007-9327/full/v31/i27/108200.htm
- DOI: https://dx.doi.org/10.3748/wjg.v31.i27.108200


