Copyright
©The Author(s) 2025.
World J Gastroenterol. Jul 21, 2025; 31(27): 108200
Published online Jul 21, 2025. doi: 10.3748/wjg.v31.i27.108200
Published online Jul 21, 2025. doi: 10.3748/wjg.v31.i27.108200
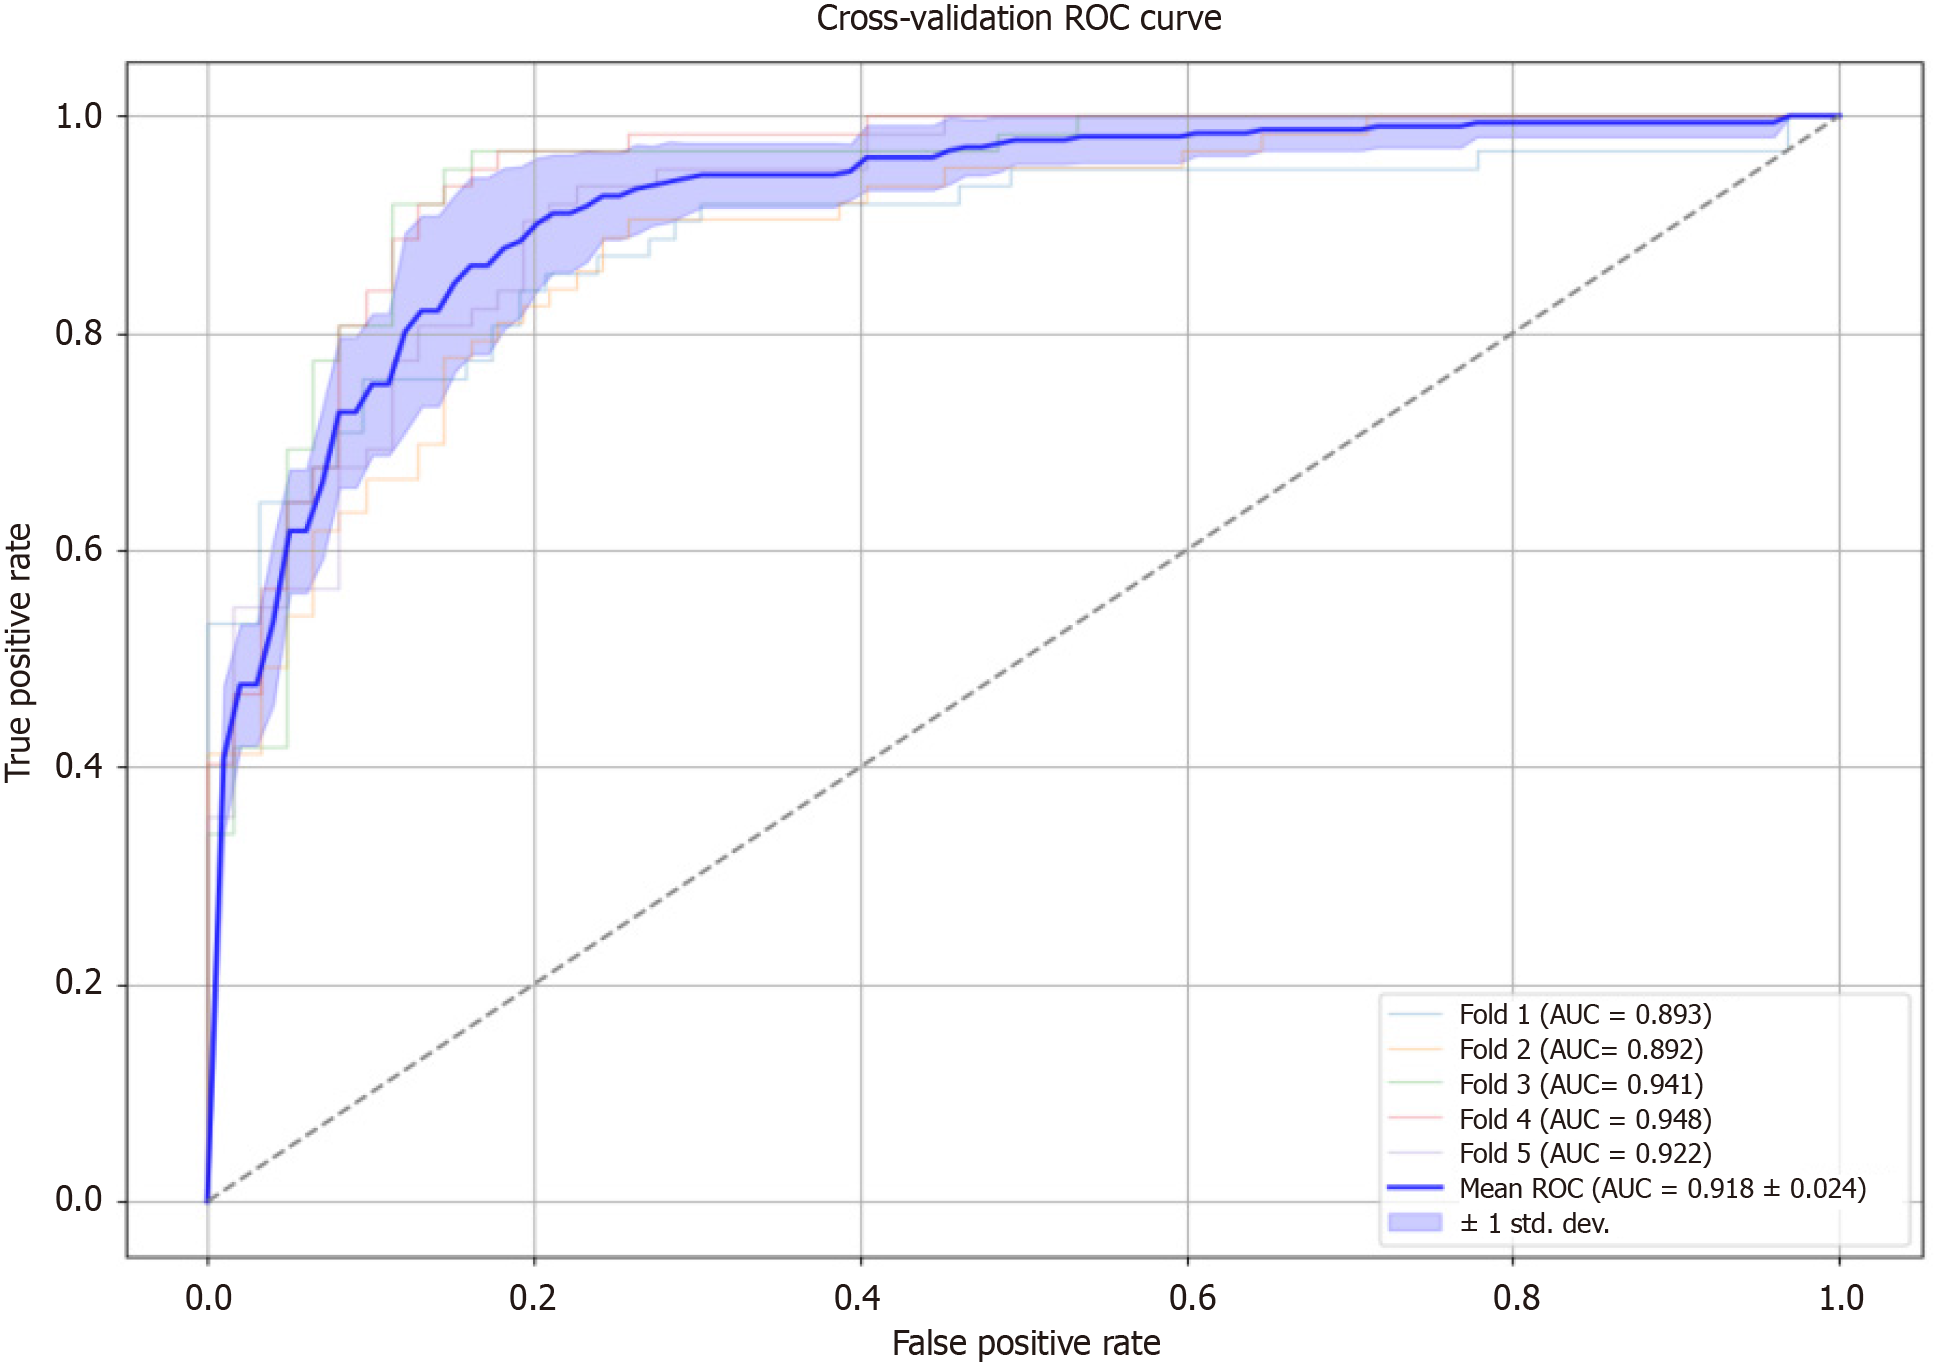
Figure 4 Cross-validation receiver operating characteristic curve.
The receiver operating characteristic curves for XGBoost model evaluated through five-fold cross-validation. The X-axis represents the false positive rate, and the Y-axis represents the true positive rate. Area under the curve is a measure of the model's overall performance, with higher values indicating better discrimination.
- Citation: Tian Y, Zhou HY, Liu ML, Ruan Y, Yan ZX, Hu XH, Du J. Machine learning-based identification of biochemical markers to predict hepatic steatosis in patients at high metabolic risk. World J Gastroenterol 2025; 31(27): 108200
- URL: https://www.wjgnet.com/1007-9327/full/v31/i27/108200.htm
- DOI: https://dx.doi.org/10.3748/wjg.v31.i27.108200


