Copyright
©The Author(s) 2025.
World J Gastroenterol. Jul 21, 2025; 31(27): 106166
Published online Jul 21, 2025. doi: 10.3748/wjg.v31.i27.106166
Published online Jul 21, 2025. doi: 10.3748/wjg.v31.i27.106166
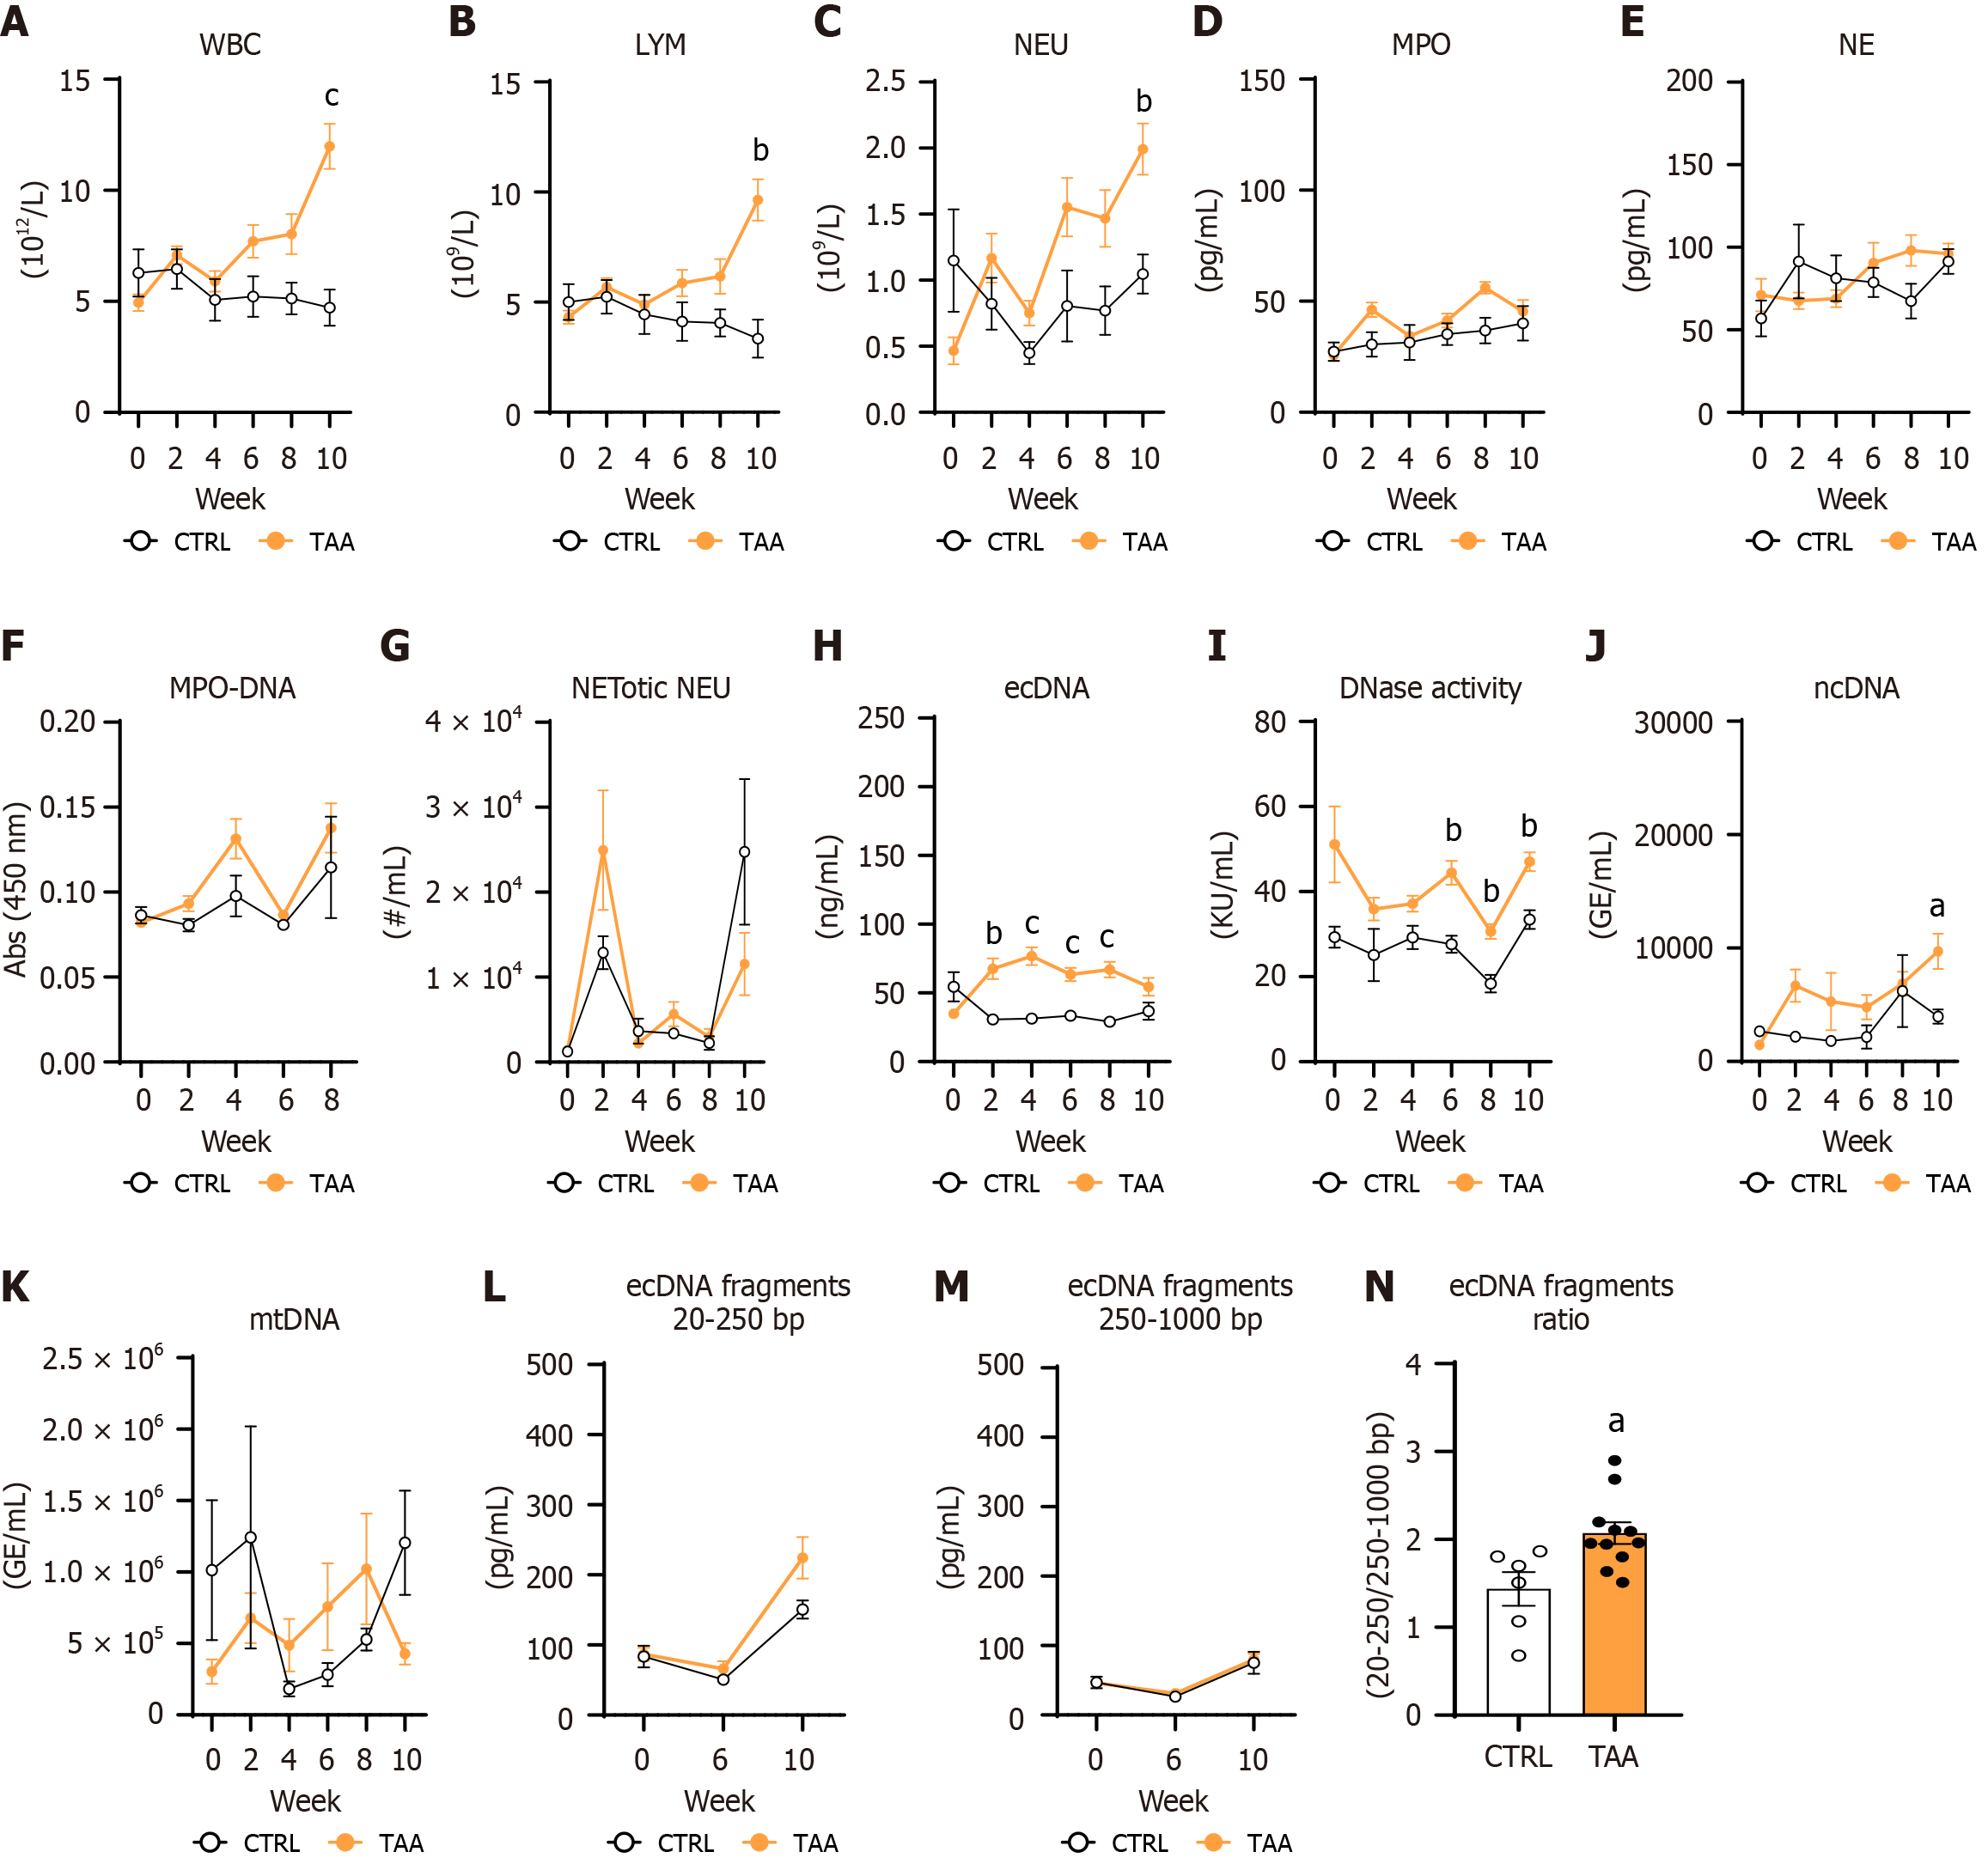
Figure 6 Thioacetamide-induced model blood cell count and neutrophil extracellular trap-associated peripheral markers.
A: White blood cell count; B: Lymphocyte count; C: Neutrophil count; D: Concentration of myeloperoxidase; E: Concentration of neutrophil elastase; F: Myeloperoxidase-DNA complex count; G: NETotic neutrophil count; H: Concentration of extracellular DNA (ecDNA); I: DNase activity; J: Concentration of nuclear DNA; K: Concentration of mitochondrial DNA; L: Concentration of small (20-250 bp) fragments of circulating ecDNA; M: Concentration of large (250-1000 bp) fragments of circulating ecDNA; N: Ratio between small and large fragments of circulating ecDNA after 10 weeks. Data are presented as mean ± SE (A-M) or standard deviation (N). aP < 0.05; bP < 0.01; cP < 0.001; A-M: Repeated two-way analysis of variance and Bonferroni post-hoc test; N: Independent Student’s t-test. VEH: Control group receiving intraperitoneal saline injections (n = 7); TAA: Experimental liver fibrosis group receiving intraperitoneal thioacetamide injections (n = 11). WBC: White blood cell; LYM: Lymphocytes; NEU: Neutrophils; MPO: Myeloperoxidase; NE: Neutrophil elastase; NET: Neutrophil extracellular trap; ecDNA: Extracellular DNA; ncDNA: Nuclear DNA; mtDNA: Mitochondrial DNA; TAA: Thioacetamide; CTRL: Control group.
- Citation: Feješ A, Belvončíková P, Bečka E, Strečanský T, Pastorek M, Janko J, Filová B, Babál P, Šebeková K, Borbélyová V, Gardlík R. Myeloperoxidase, extracellular DNA and neutrophil extracellular trap formation in the animal models of metabolic dysfunction-associated steatotic liver disease. World J Gastroenterol 2025; 31(27): 106166
- URL: https://www.wjgnet.com/1007-9327/full/v31/i27/106166.htm
- DOI: https://dx.doi.org/10.3748/wjg.v31.i27.106166


