Copyright
©The Author(s) 2025.
World J Gastroenterol. Jul 21, 2025; 31(27): 106166
Published online Jul 21, 2025. doi: 10.3748/wjg.v31.i27.106166
Published online Jul 21, 2025. doi: 10.3748/wjg.v31.i27.106166
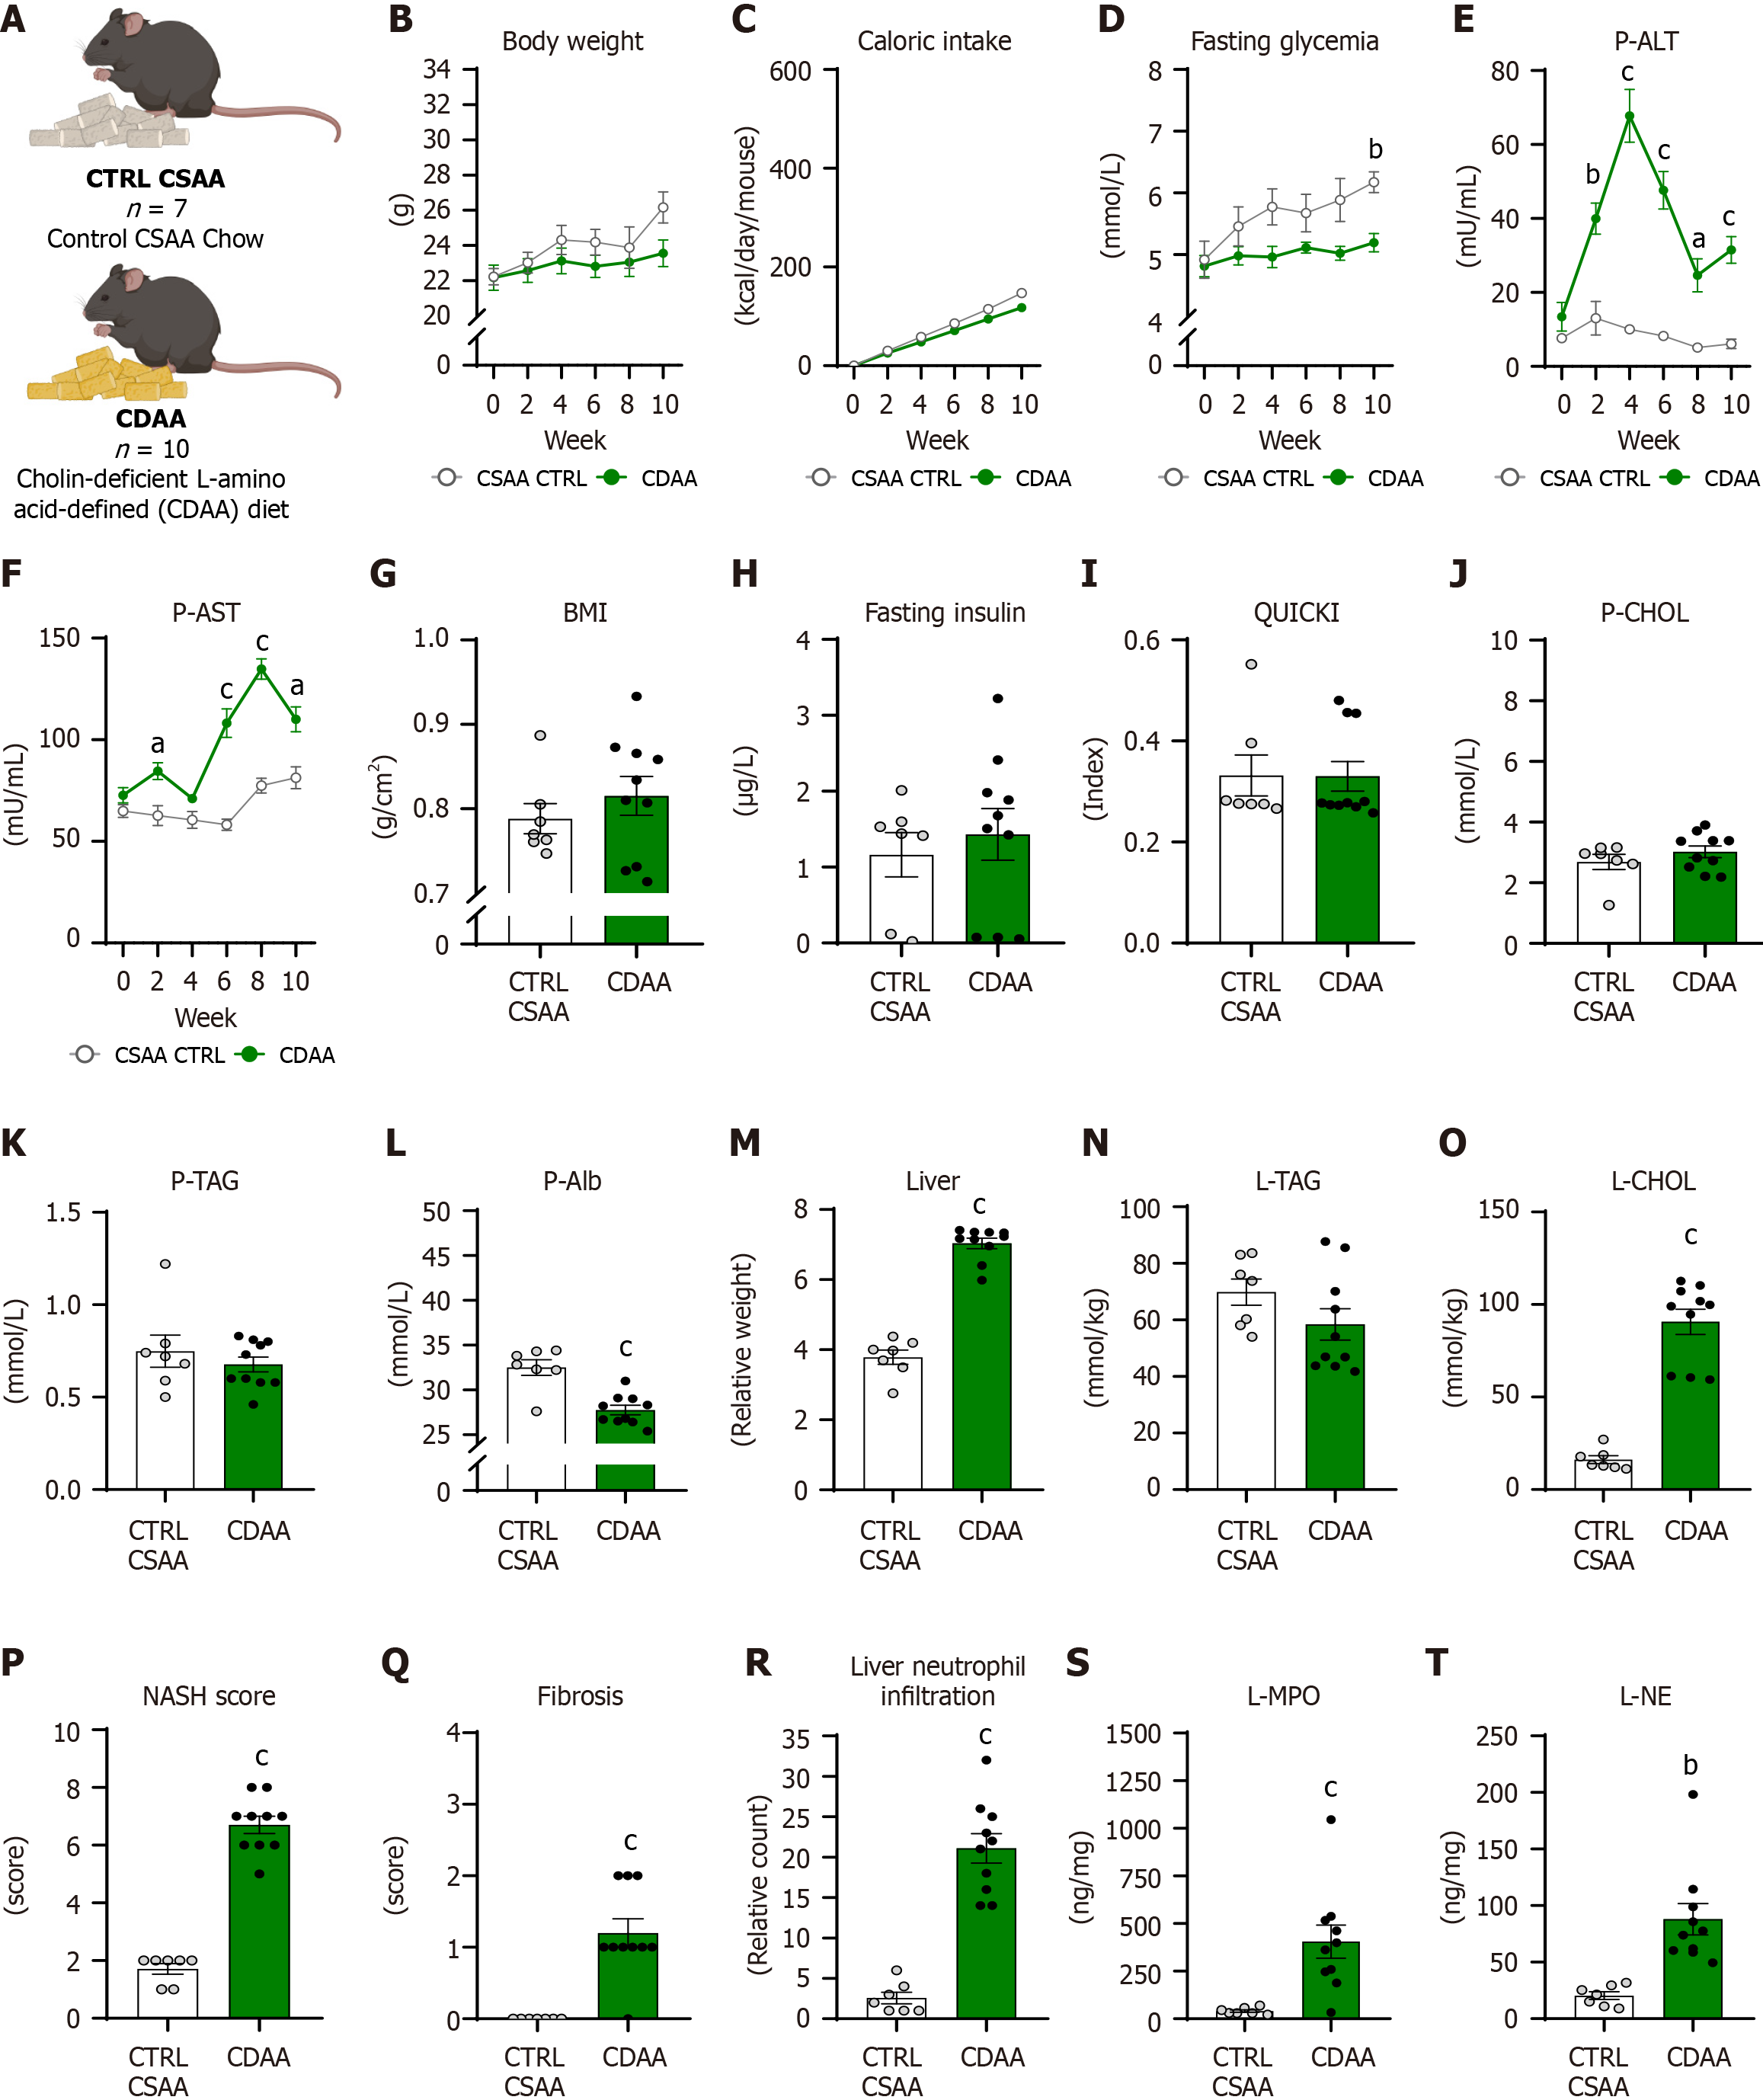
Figure 4 Choline-deficient L-amino acid-defined diet-induced model liver damage-associated and metabolic parameters.
A: Experimental design; B: Dynamics of body weight; C: Dynamics of cumulative caloric intake; D: Dynamics of fasting glycemia; E: Dynamics of alanine aminotransferase activity; F: Dynamics of aspartate aminotransferase activity; G: Body mass index; H: Concentrations of fasting insulin; I: Quantitative index of insulin sensitivity; J: Concentrations of cholesterol; K: Concentrations of triacylglycerols; L: Concentrations of albumin; M: Relative liver weight; N: Concentration of liver triacylglycerides; O: Concentration of liver cholesterol; P: Nonalcoholic steatohepatitis score; Q: Fibrotic score; R: Neutrophil infiltration into the liver; S: Concentration of myeloperoxidase in the liver; T: Concentration of neutrophil elastase in the liver. Data shown in G-T are after 10 weeks of the choline-deficient L-amino acid-defined (CDAA) model. Data are presented as mean ± SE. aP < 0.05; bP < 0.01; cP < 0.001; B-F: Repeated two-way analysis of variance and Bonferroni post-hoc test; G-T: Independent Student’s t-test. CTRL CSAA: Control group (n = 7); CDAA: Experimental liver steatosis group (n = 10). CTRL CSAA: Choline-sufficient L-amino acid-defined control; CDAA: Choline-deficient L-amino acid-defined. MPO: Myeloperoxidase; ALT: Alanine aminotransferase; AST: Aspartate aminotransferase; BMI: Body mass index; NASH: Nonalcoholic steatohepatitis; NE: Neutrophil elastase.
- Citation: Feješ A, Belvončíková P, Bečka E, Strečanský T, Pastorek M, Janko J, Filová B, Babál P, Šebeková K, Borbélyová V, Gardlík R. Myeloperoxidase, extracellular DNA and neutrophil extracellular trap formation in the animal models of metabolic dysfunction-associated steatotic liver disease. World J Gastroenterol 2025; 31(27): 106166
- URL: https://www.wjgnet.com/1007-9327/full/v31/i27/106166.htm
- DOI: https://dx.doi.org/10.3748/wjg.v31.i27.106166


