Copyright
©The Author(s) 2025.
World J Gastroenterol. Jul 14, 2025; 31(26): 108662
Published online Jul 14, 2025. doi: 10.3748/wjg.v31.i26.108662
Published online Jul 14, 2025. doi: 10.3748/wjg.v31.i26.108662
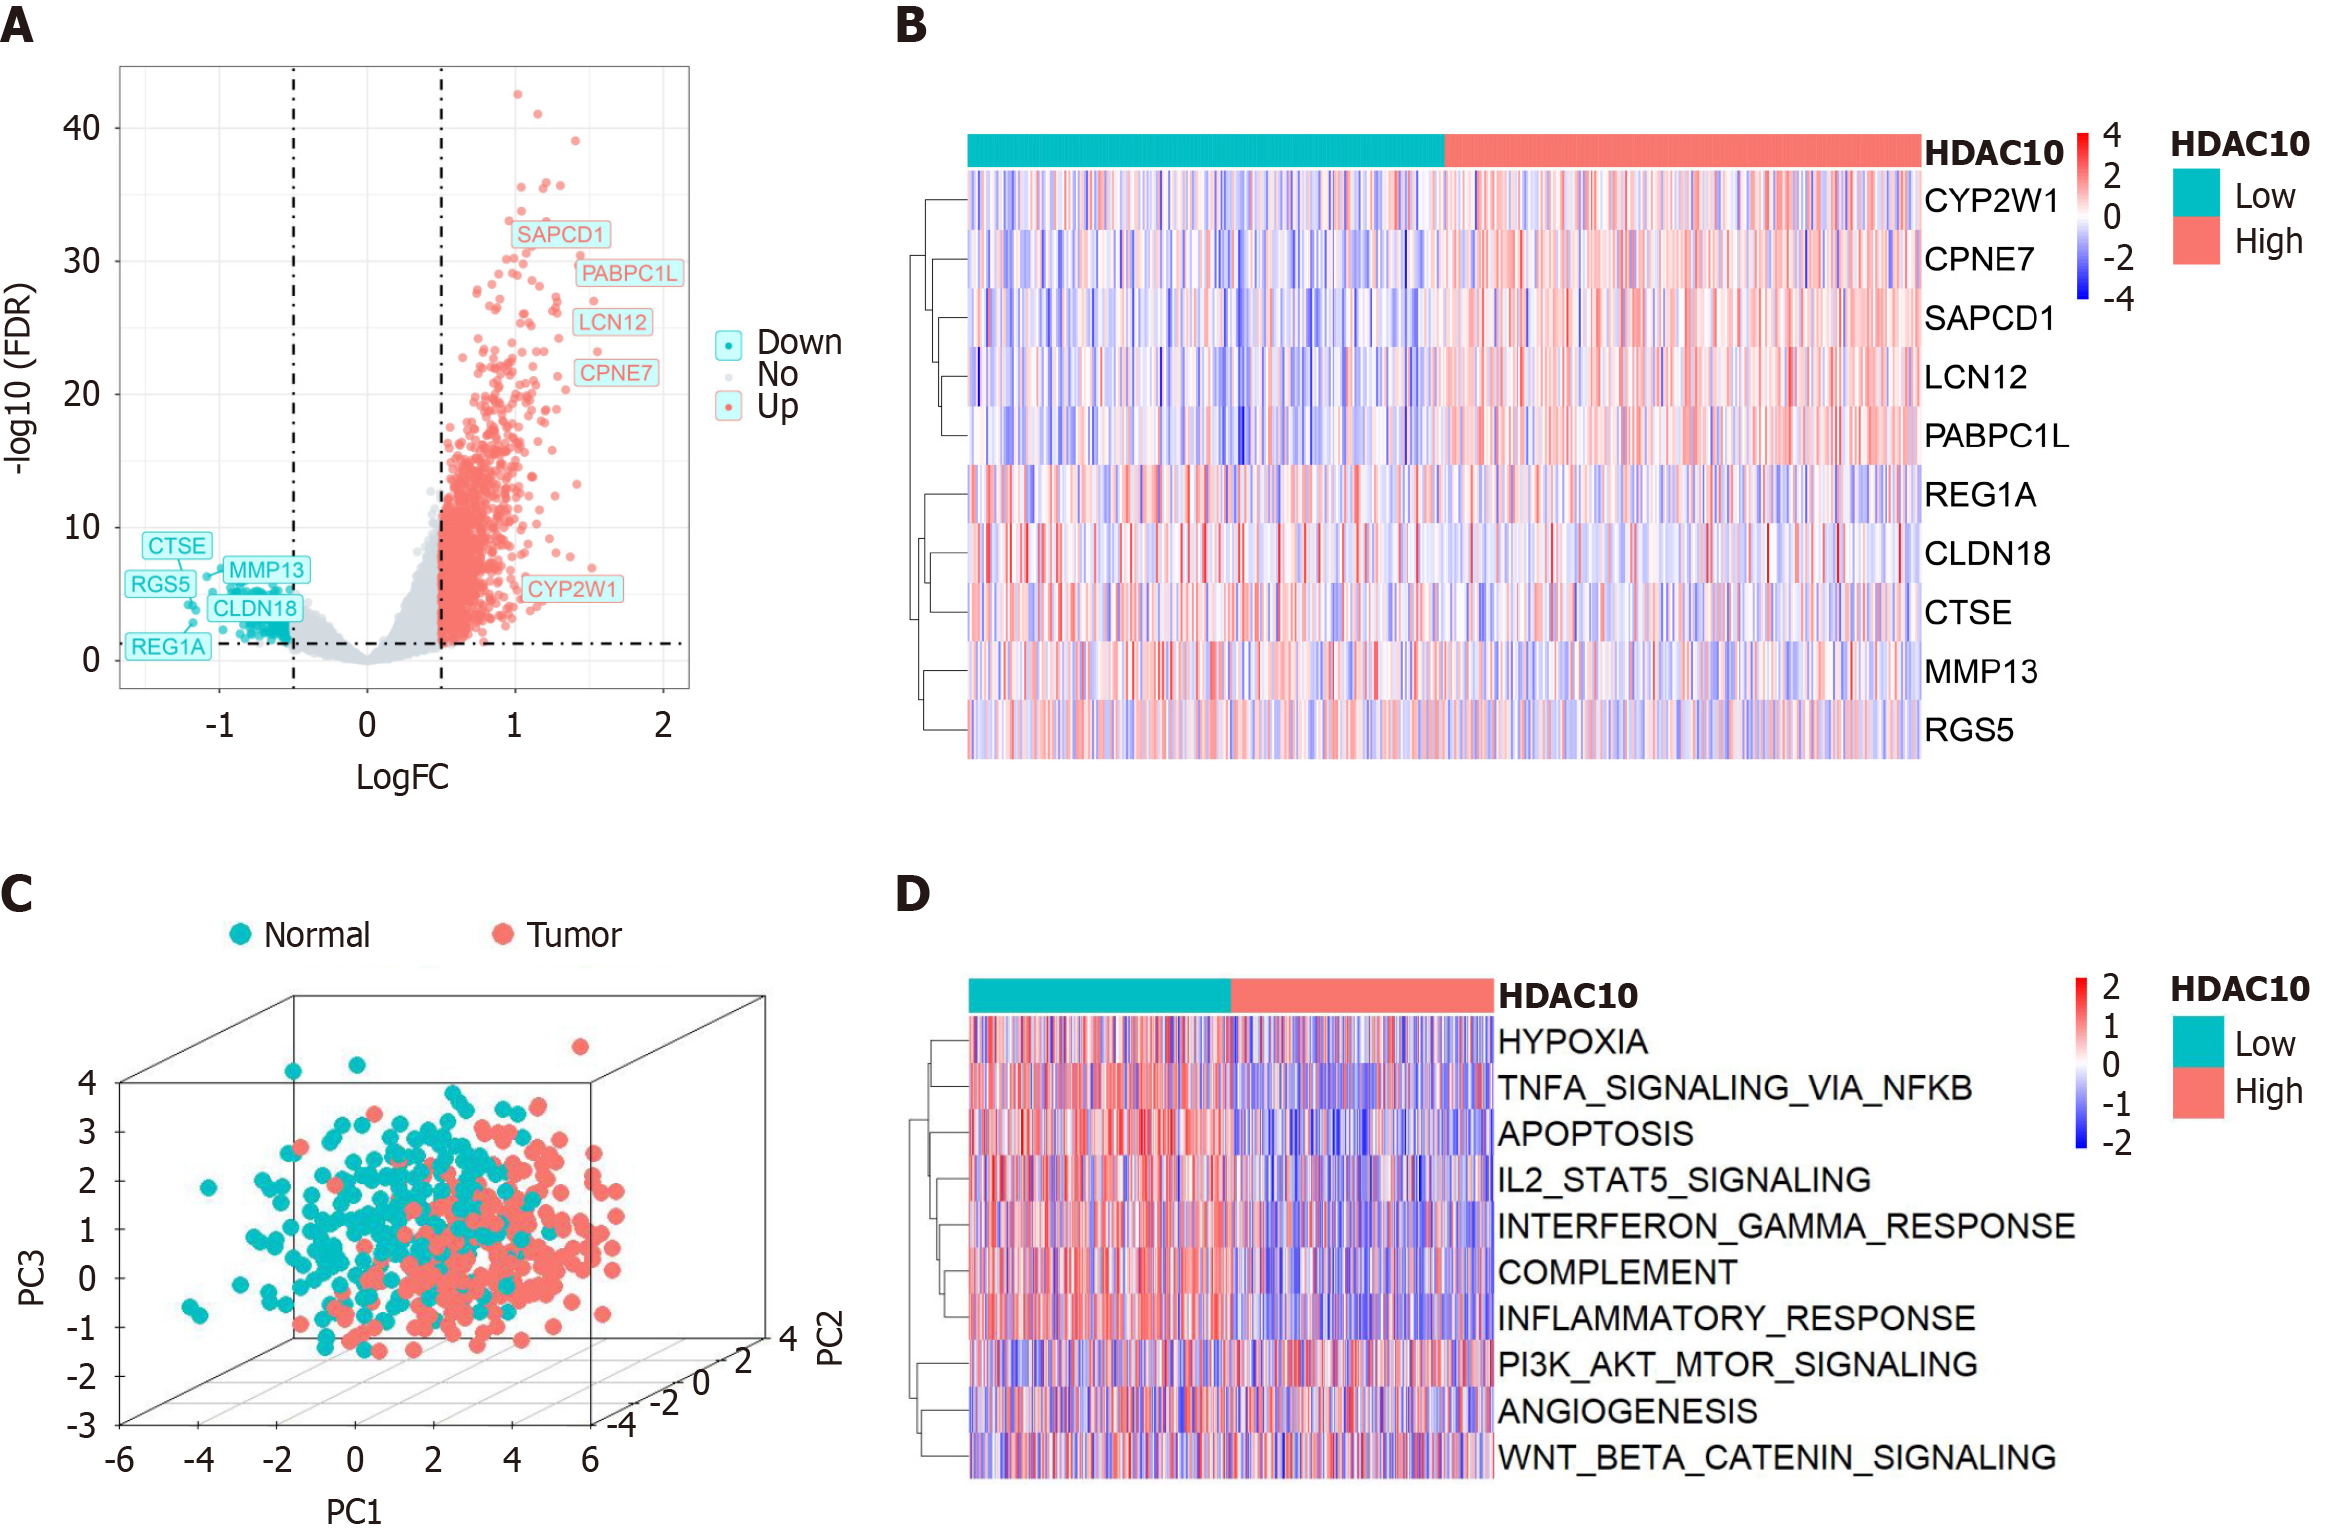
Figure 4 Differential analysis and functional enrichment analysis.
A: Volcano plot from the top five upregulated and downregulated differentially expressed genes (DEGs) between high and low-histone deacetylases 10 group; B: Heat map showed the top five genes in both upregulated and downregulated DEGs; C: Different expression levels of DEGs between normal colon and colorectal cancer; D: Gene set variation analysis showed the activation status of biological pathways in two groups. HDAC10: Histone deacetylases 10.
- Citation: Nie HH, Yang XY, Zhou JK, Gao GL, Ding L, Hong YT, Yu YL, Qiu PS, Zeng ZY, Lai J, Zheng T, Wang HZ, Zhao Q, Wang F. Histone deacetylases 10 as a prognostic biomarker correlates with tumor microenvironment and therapy response in colorectal cancer. World J Gastroenterol 2025; 31(26): 108662
- URL: https://www.wjgnet.com/1007-9327/full/v31/i26/108662.htm
- DOI: https://dx.doi.org/10.3748/wjg.v31.i26.108662


