Copyright
©The Author(s) 2025.
World J Gastroenterol. Jul 14, 2025; 31(26): 107419
Published online Jul 14, 2025. doi: 10.3748/wjg.v31.i26.107419
Published online Jul 14, 2025. doi: 10.3748/wjg.v31.i26.107419
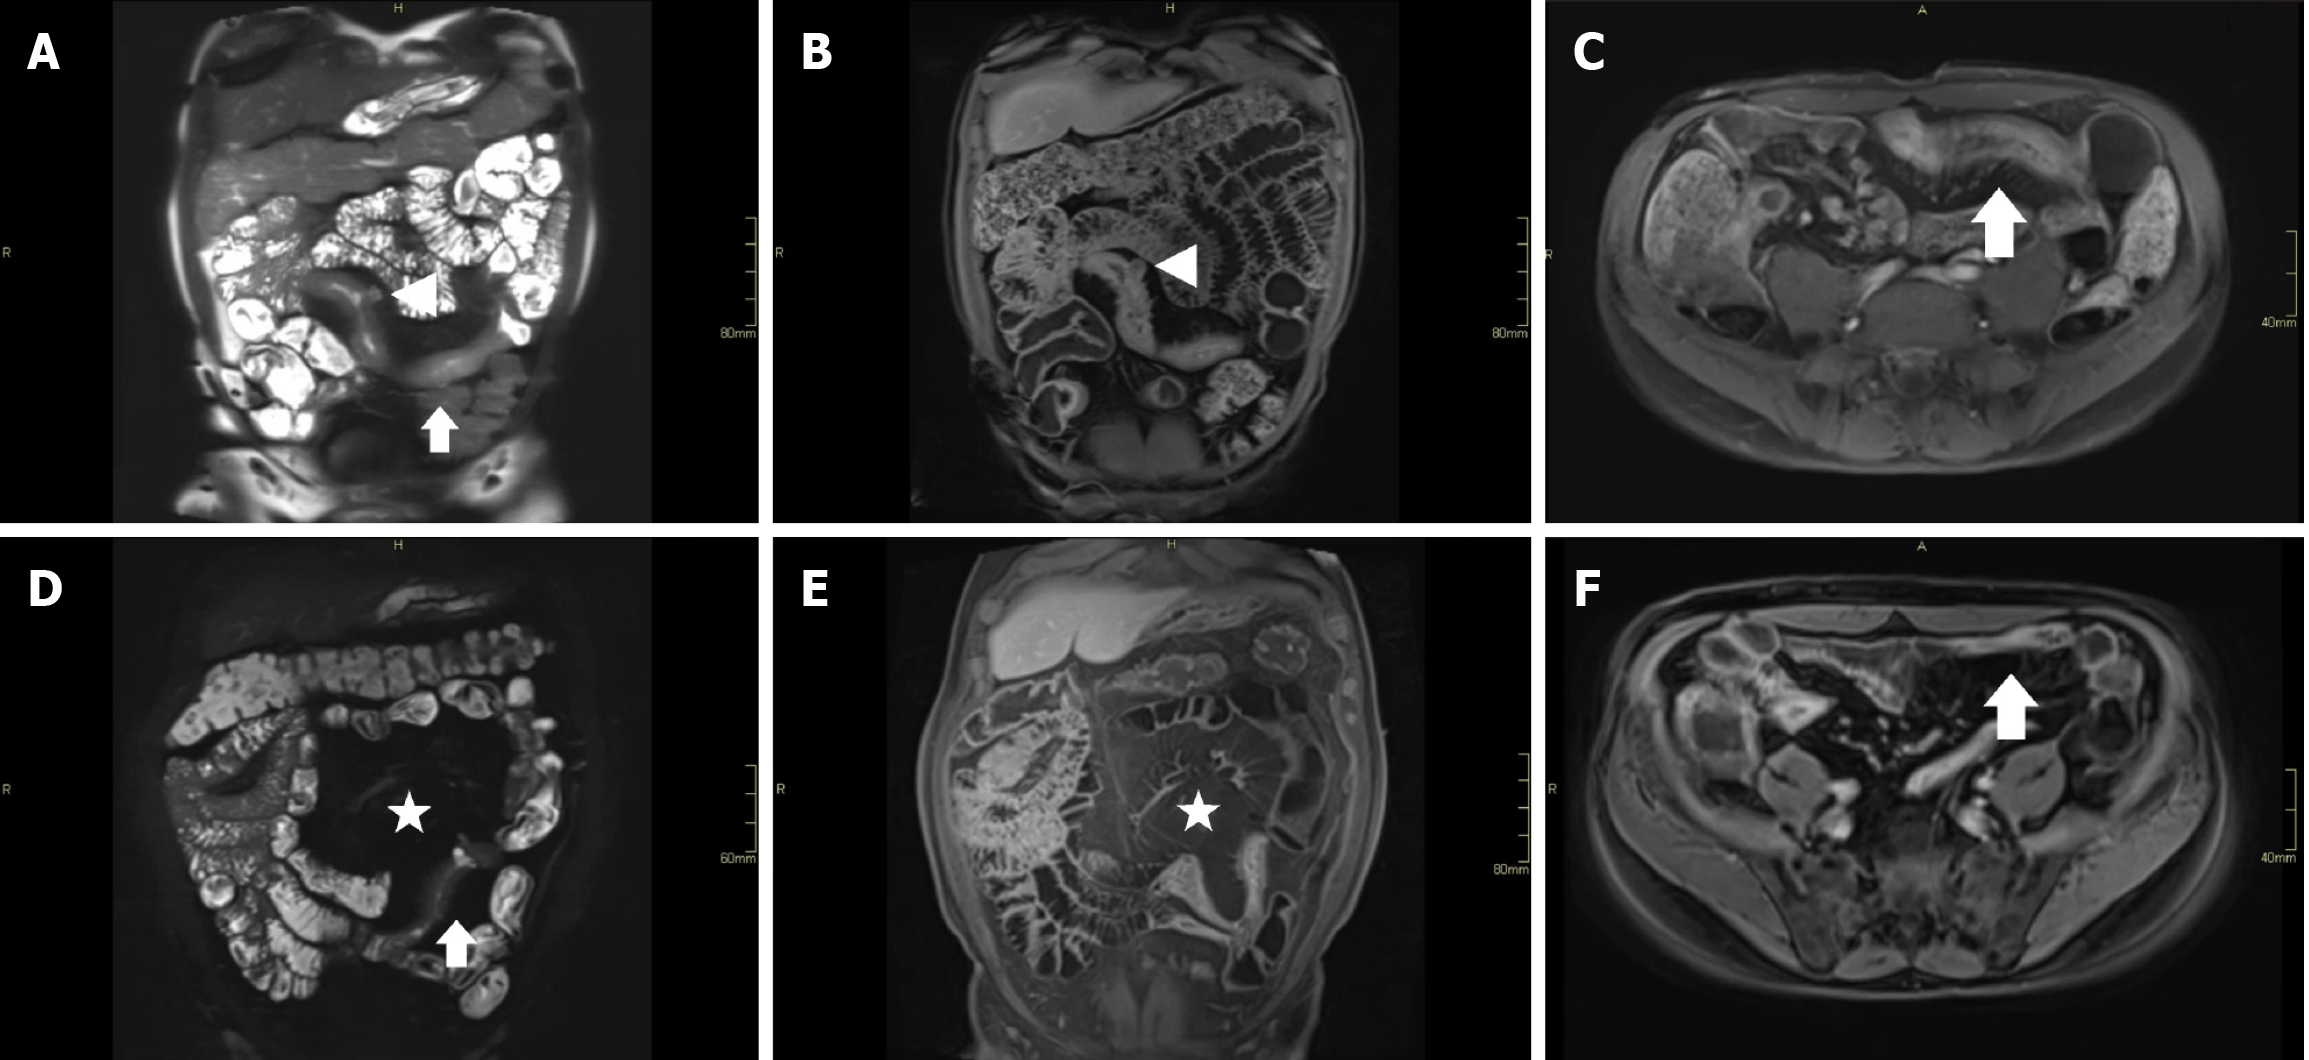
Figure 4 Application of magnetic resonance index of activity and simplified magnetic resonance index of activity scores in luminal Crohn’s disease.
A-C: Baseline magnetic resonance enterography (MRE): Magnetic resonance index of activity (MaRIA) = 21.2, simplified MaRIA = 5; Baseline MRE shows mid small bowel wall thickening (arrows in A and C), mural oedema (arrows in A), transmural ulceration (arrowheads in A and B) and hyperenhancement (arrows in C); D-F: Follow-up MRE: MaRIA = 16.5, simplified MaRIA = 2; Follow-up MRE shows creeping fat (star in D and E) and reduced wall thickening (arrows in D and F). MRE sequences: A and D: Coronal T2 fat-suppressed; B and E: Coronal post contrast T1 fat-suppressed; C and F: Axial post contrast T1 fat-suppressed.
- Citation: Lo RW, Bhatnagar G, Kutaiba N, Srinivasan AR. Evaluating luminal and post-operative Crohn’s disease activity on magnetic resonance enterography: A review of radiological disease activity scores. World J Gastroenterol 2025; 31(26): 107419
- URL: https://www.wjgnet.com/1007-9327/full/v31/i26/107419.htm
- DOI: https://dx.doi.org/10.3748/wjg.v31.i26.107419


