Copyright
©The Author(s) 2025.
World J Gastroenterol. Jul 14, 2025; 31(26): 107044
Published online Jul 14, 2025. doi: 10.3748/wjg.v31.i26.107044
Published online Jul 14, 2025. doi: 10.3748/wjg.v31.i26.107044
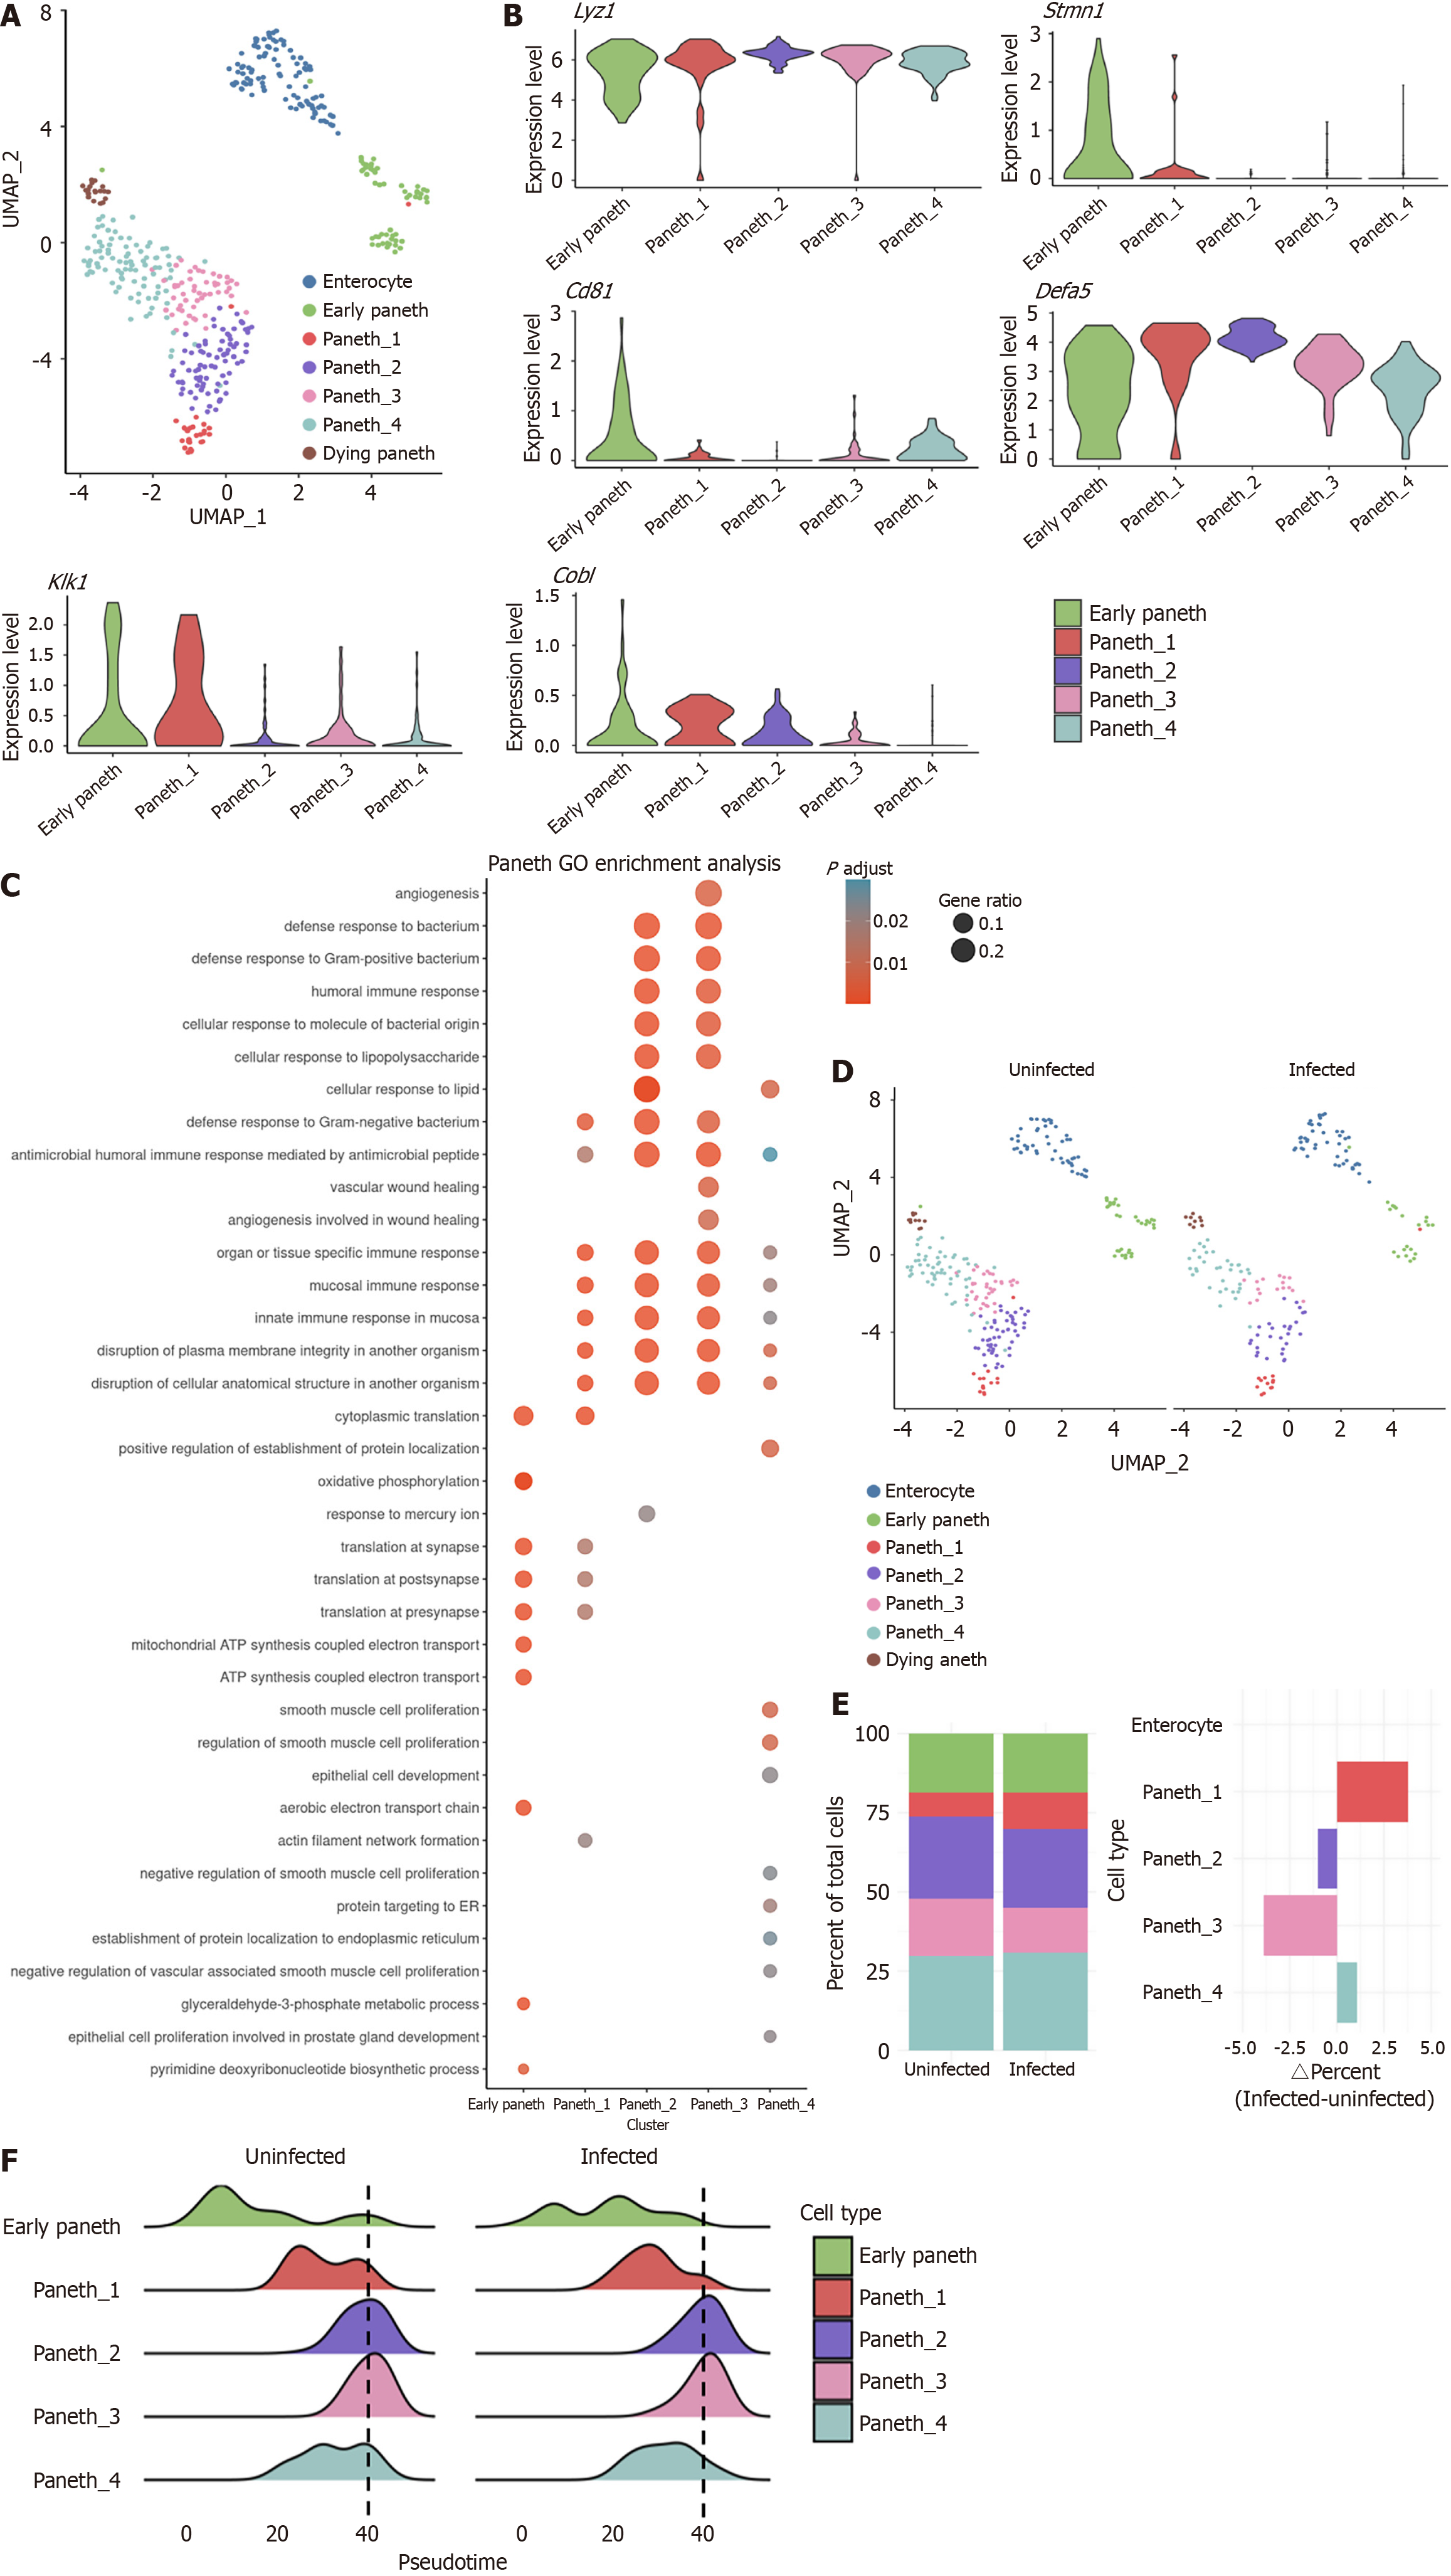
Figure 2 Reduction of mature Paneth cells with an increased proportion of the kallikrein 1 cluster.
A: The Paneth cell cluster in Figure 1B were re-clustered. Uniform manifold approximation and projection of combined subclustered Paneth cells from uninfected and infected mice; B: Expression of representative marker genes of subclustered Paneth cells; C: Enriched Gene Ontology terms for main clusters in Paneth cells; D: Uniform manifold approximation and projections of uninfected Paneth cells (left) vs infected Paneth cells (right); E: Quantification of percent cells per cluster (left) and difference in percent of uninfected and infected cells (right); F: Pseudotime trajectory analysis of uninfected Paneth cells (left) vs infected Paneth cells (right). UMAP: Uniform manifold approximation and projection; Lyz: Lysozyme; Klk: Kallikrein; GO: Gene Ontology.
- Citation: Bu XY, Tan HY, Wang AM, Wei MT, Pan S, Gao JZ, Li YH, Qian GX, Chen ZH, Ye C, Jia WD. Paneth cells inhibit intestinal stem cell proliferation through the bone morphogenic protein 7 pathway under rotavirus-mediated intestinal injury. World J Gastroenterol 2025; 31(26): 107044
- URL: https://www.wjgnet.com/1007-9327/full/v31/i26/107044.htm
- DOI: https://dx.doi.org/10.3748/wjg.v31.i26.107044


