Copyright
©The Author(s) 2025.
World J Gastroenterol. Jul 7, 2025; 31(25): 107478
Published online Jul 7, 2025. doi: 10.3748/wjg.v31.i25.107478
Published online Jul 7, 2025. doi: 10.3748/wjg.v31.i25.107478
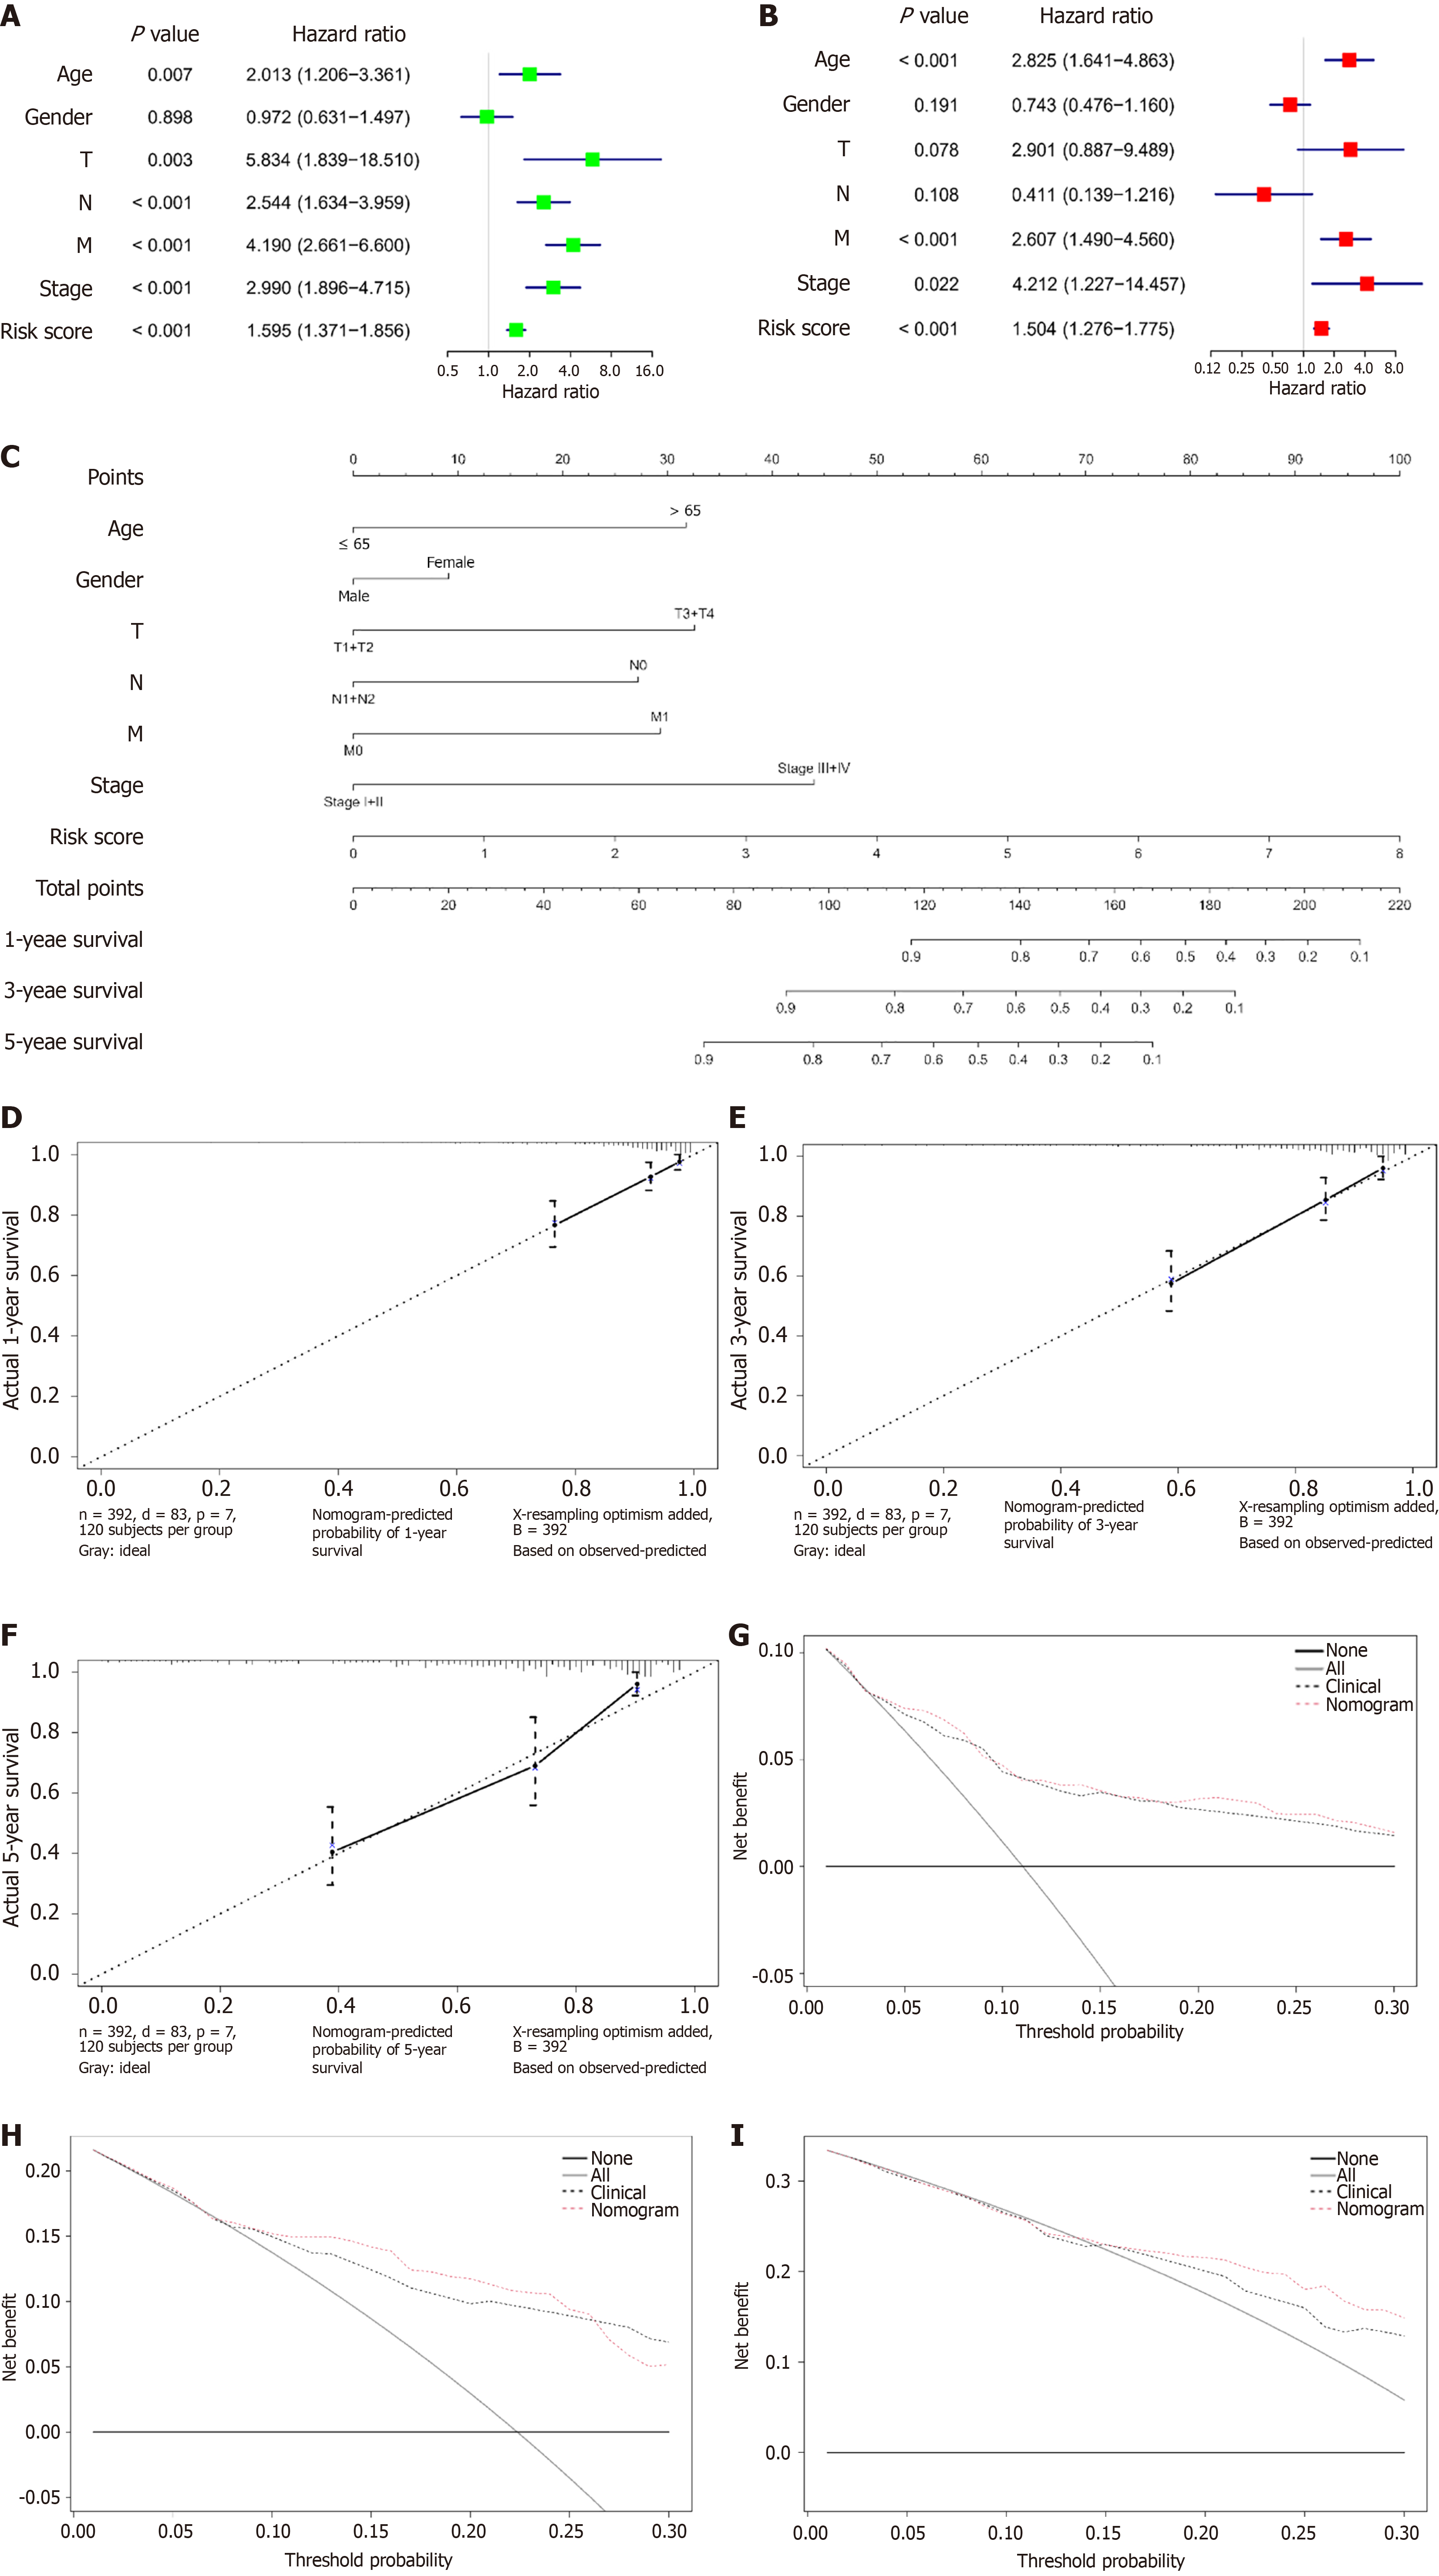
Figure 7 Nomogram model for predicting survival in colorectal cancer patients.
A: Forest plot of univariate Cox analysis combining clinical information and the risk score in The Cancer Genome Atlas database-colon and rectal adenocarcinomas cohort; B: Forest plot of multivariate Cox analysis combining clinical information and the risk score in The Cancer Genome Atlas database-colon and rectal adenocarcinomas cohort; C: Nomogram model constructed by integrating clinical information and the risk score; D: Calibration curve for 1-year survival; E: Calibration curve for 3-year survival; F: Calibration curve for 5-year survival; G: Decision curve for 1-year survival; H: Decision curve for 3-year survival; I: Decision curve for 5-year survival. T: Tumor; N: Node; M: Metastasis.
- Citation: Wang XP, Zhu JX, Liu C, Zhang HW, Sun GD, Zhai JM, Yang HJ, Liu DC. Deciphering lactate metabolism in colorectal cancer: Prognostic modeling, immune infiltration, and gene mutation insights. World J Gastroenterol 2025; 31(25): 107478
- URL: https://www.wjgnet.com/1007-9327/full/v31/i25/107478.htm
- DOI: https://dx.doi.org/10.3748/wjg.v31.i25.107478


