Copyright
©The Author(s) 2025.
World J Gastroenterol. Jul 7, 2025; 31(25): 107478
Published online Jul 7, 2025. doi: 10.3748/wjg.v31.i25.107478
Published online Jul 7, 2025. doi: 10.3748/wjg.v31.i25.107478
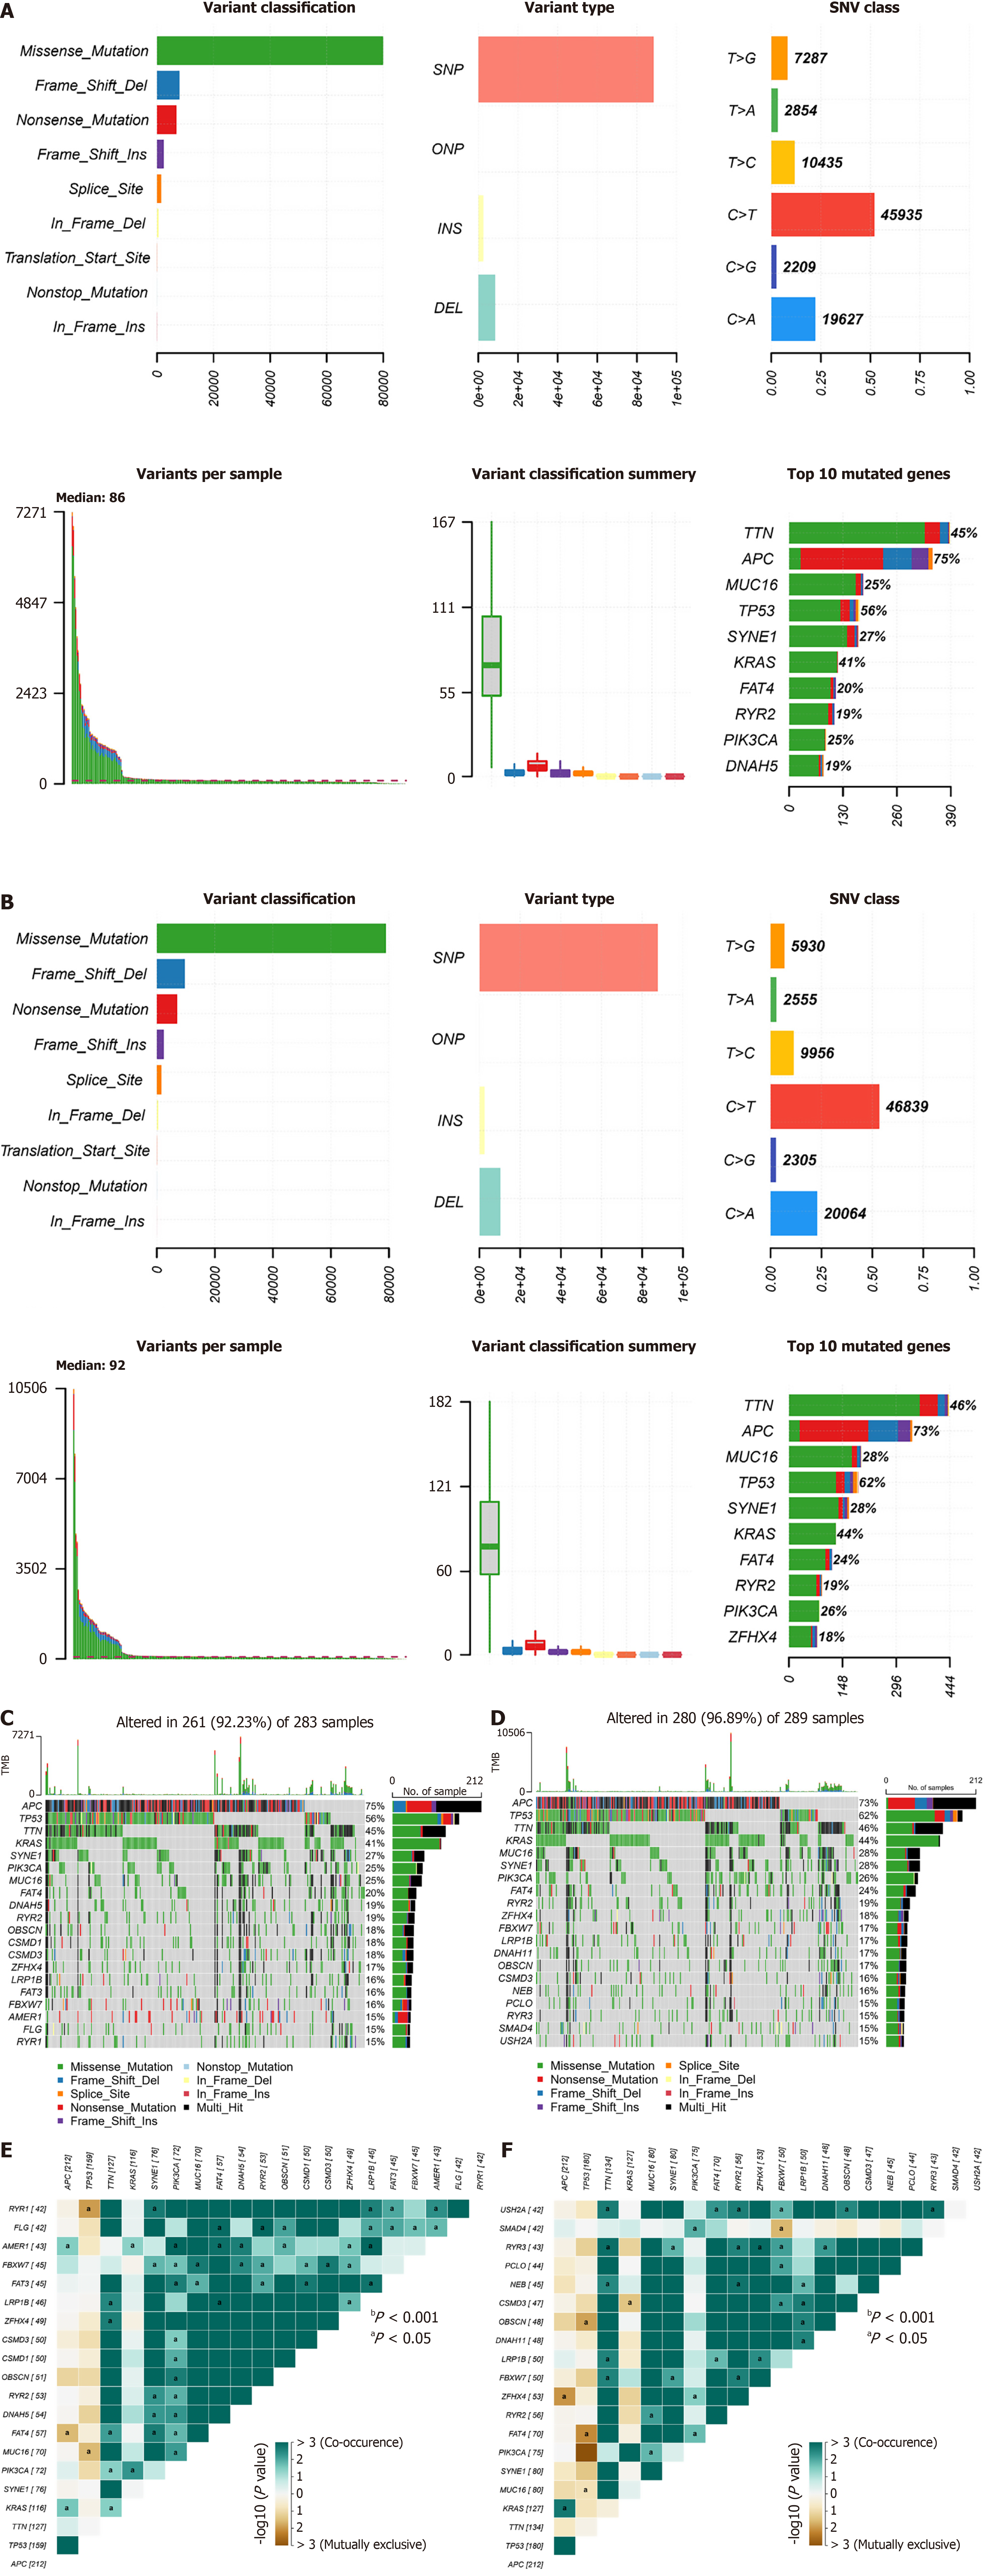
Figure 5 Landscape of mutations in patients in the risk score subgroups.
A: Distribution of single nucleotide variant types in tumor samples in the low-risk score group; B: Distribution of single nucleotide variant types in tumor samples in the high-risk score group; C: Most common mutated genes in the low-risk score group and their mutation frequencies in the samples; D: The most common mutated genes in the high-risk score group and their mutation frequencies in the samples; E: Analysis of the relationships between cooccurring genes and mutually exclusive genes in the low-risk score group; F: Analysis of gene cooccurrences and mutually exclusive relationships in the high-risk score group. aP < 0.05. SNV: Single nucleotide variant; SNP: Single nucleotide polymorphisms; ONP: Oligonucleotide polymorphism; INS: Insertion; DEL: Deletion; TMB: Tumor mutation burden.
- Citation: Wang XP, Zhu JX, Liu C, Zhang HW, Sun GD, Zhai JM, Yang HJ, Liu DC. Deciphering lactate metabolism in colorectal cancer: Prognostic modeling, immune infiltration, and gene mutation insights. World J Gastroenterol 2025; 31(25): 107478
- URL: https://www.wjgnet.com/1007-9327/full/v31/i25/107478.htm
- DOI: https://dx.doi.org/10.3748/wjg.v31.i25.107478


