Copyright
©The Author(s) 2025.
World J Gastroenterol. Jul 7, 2025; 31(25): 107478
Published online Jul 7, 2025. doi: 10.3748/wjg.v31.i25.107478
Published online Jul 7, 2025. doi: 10.3748/wjg.v31.i25.107478
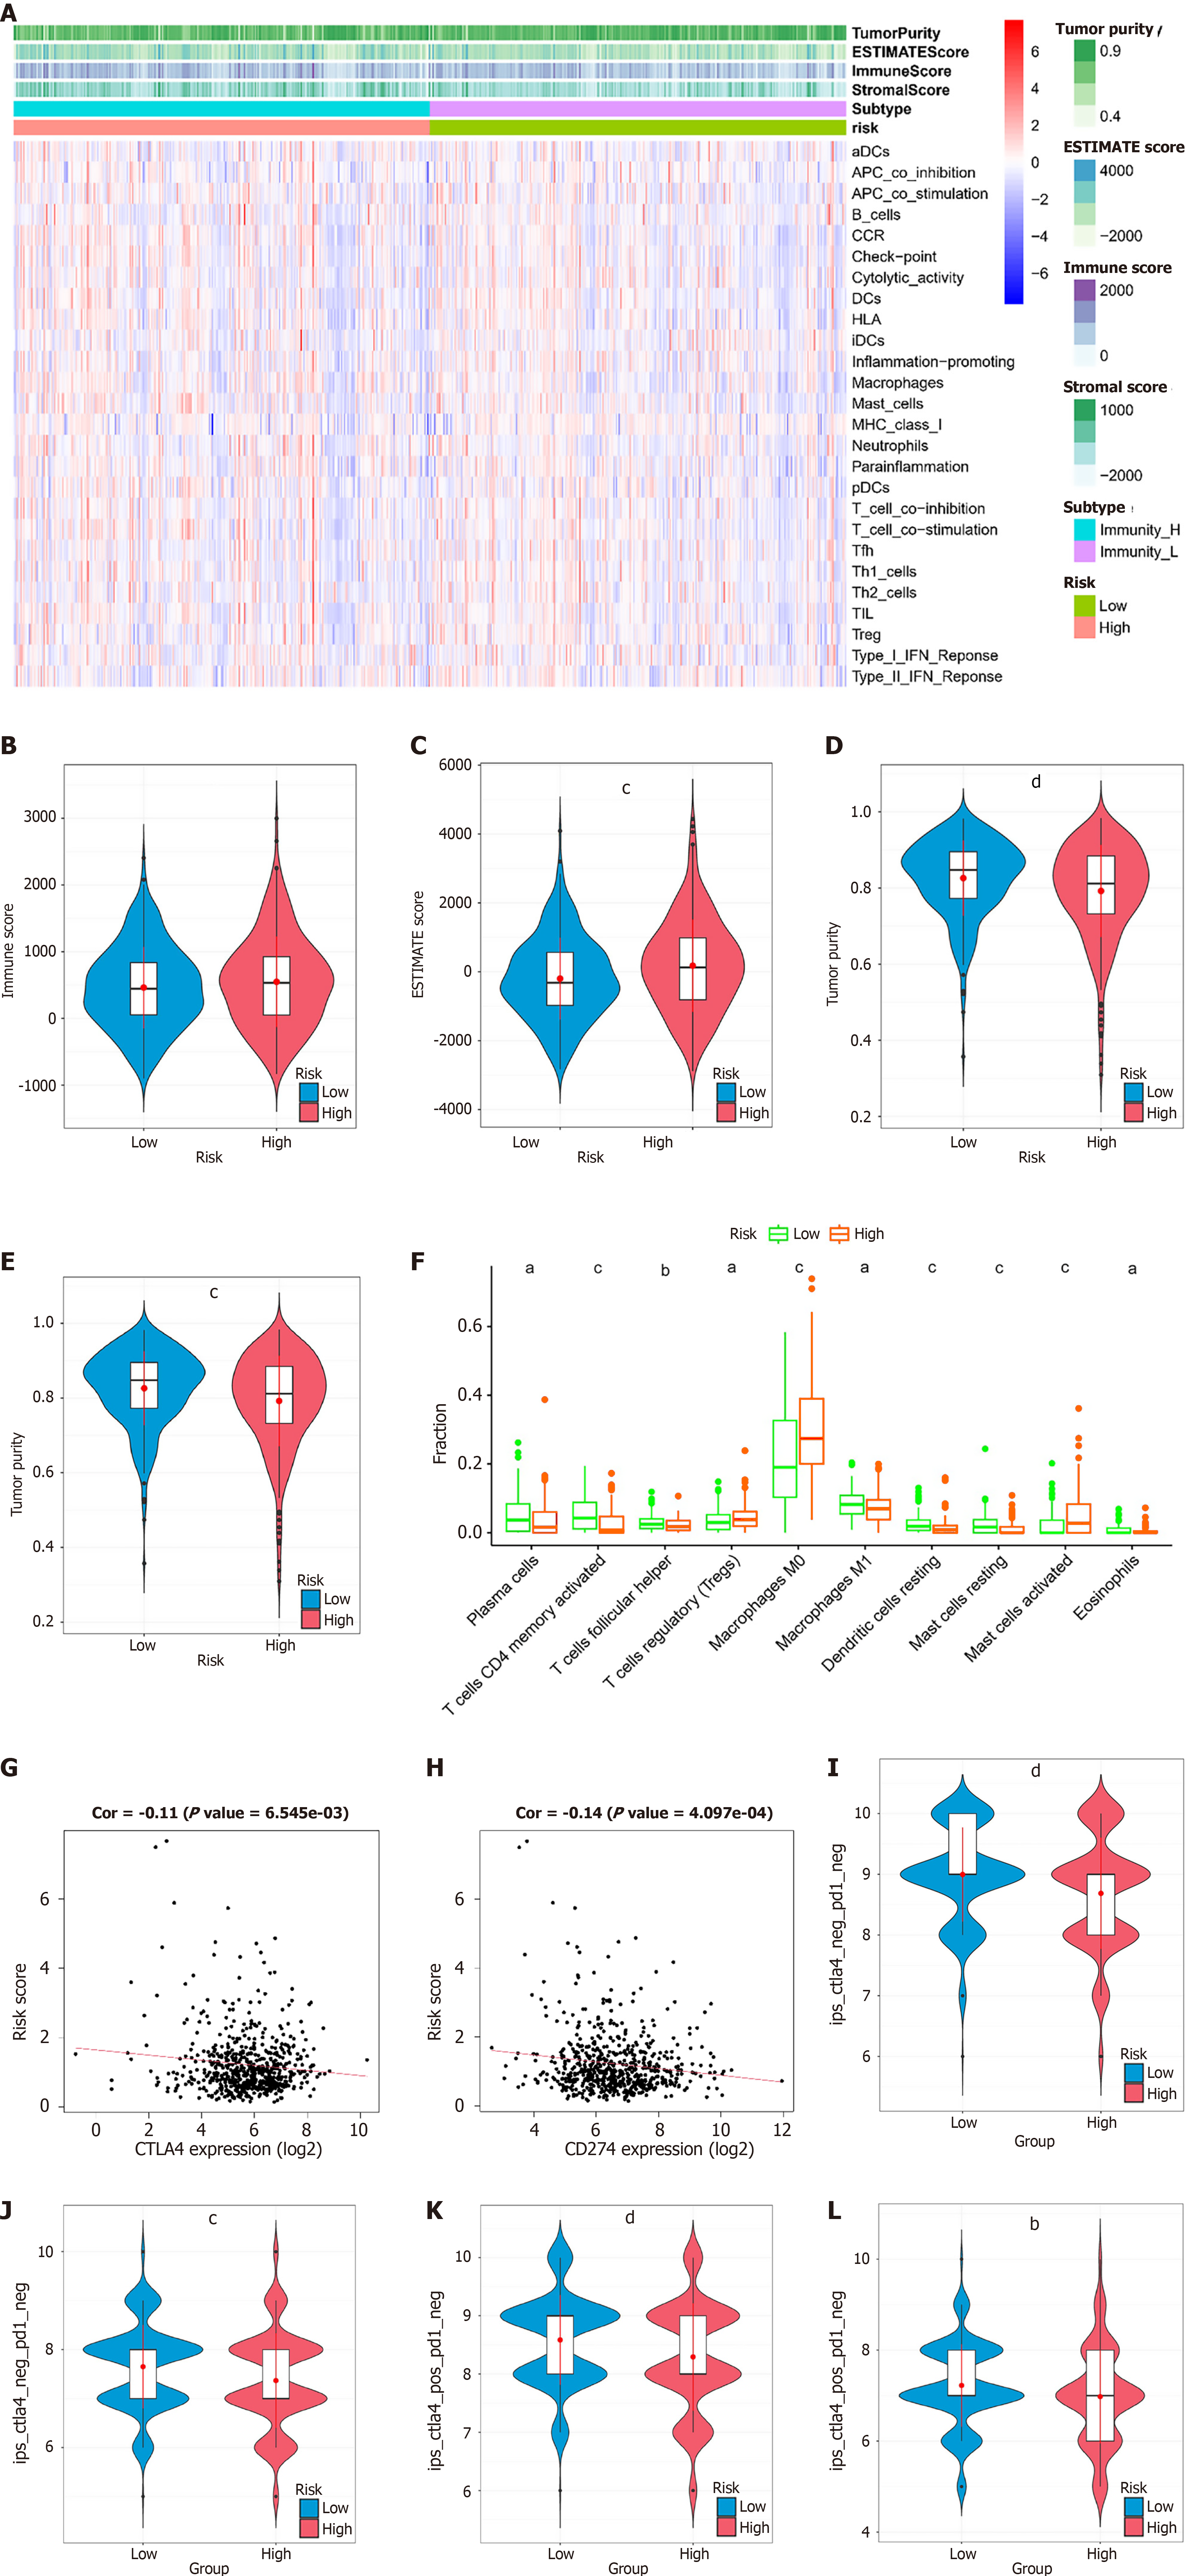
Figure 4 Immune infiltration and immunotherapy sensitivity in the risk score subgroups.
A: Heatmap of immune cell infiltration levels according to single-sample gene set enrichment analysis results and estimation of stromal and immune cells in malignant tumor tissues using expression data results; B: Violin plot demonstrating the immune score in the high- and low-risk score groups; C: Violin plot demonstrating the stromal score in the high- and low-risk score groups; D: Violin plot showing the estimation of stromal and immune cells in malignant tumor tissues using expression data score in the high- and low-risk score groups; E: Violin plot demonstrating tumor purity in the high- and low-risk score groups; F: Cell type identification by estimating relative subsets of RNA transcripts results demonstrating the infiltration levels of 10 immune cells in the high- and low-risk score groups; G: Scatter plot of the correlation between the risk score and cytotoxic T lymphocyte associated protein 4 expression level; H: Scatterplot of the correlation between the risk score and CD274 expression level; I: Immunopheno score (IPS) of cytotoxic T lymphocyte antigen 4 (CTLA-4)-negative/programmed death-1(PD-1)-negative colorectal cancer (CRC) patients in the high- and low-risk score subgroups; J: IPS of CTLA-4-negative/PD-1-positive CRC patients in the high- and low-risk score subgroups; K: IPS of CTLA-4-positive/PD-1-negative CRC patients in the high- and low-risk score subgroups; L: IPS of CTLA-4-positive and PD-1-positive CRC patients in the high- and low-risk score subgroups. aP < 0.05, bP < 0.01, cP < 0.001, dP < 0.0001, denote significant difference from the low-risk score subgroups. ESTIMATE: Estimation of stromal and immune cells in malignant tumor tissues using expression data; CTLA: Cytotoxic T lymphocyte antigen.
- Citation: Wang XP, Zhu JX, Liu C, Zhang HW, Sun GD, Zhai JM, Yang HJ, Liu DC. Deciphering lactate metabolism in colorectal cancer: Prognostic modeling, immune infiltration, and gene mutation insights. World J Gastroenterol 2025; 31(25): 107478
- URL: https://www.wjgnet.com/1007-9327/full/v31/i25/107478.htm
- DOI: https://dx.doi.org/10.3748/wjg.v31.i25.107478


