Copyright
©The Author(s) 2025.
World J Gastroenterol. Jul 7, 2025; 31(25): 107478
Published online Jul 7, 2025. doi: 10.3748/wjg.v31.i25.107478
Published online Jul 7, 2025. doi: 10.3748/wjg.v31.i25.107478
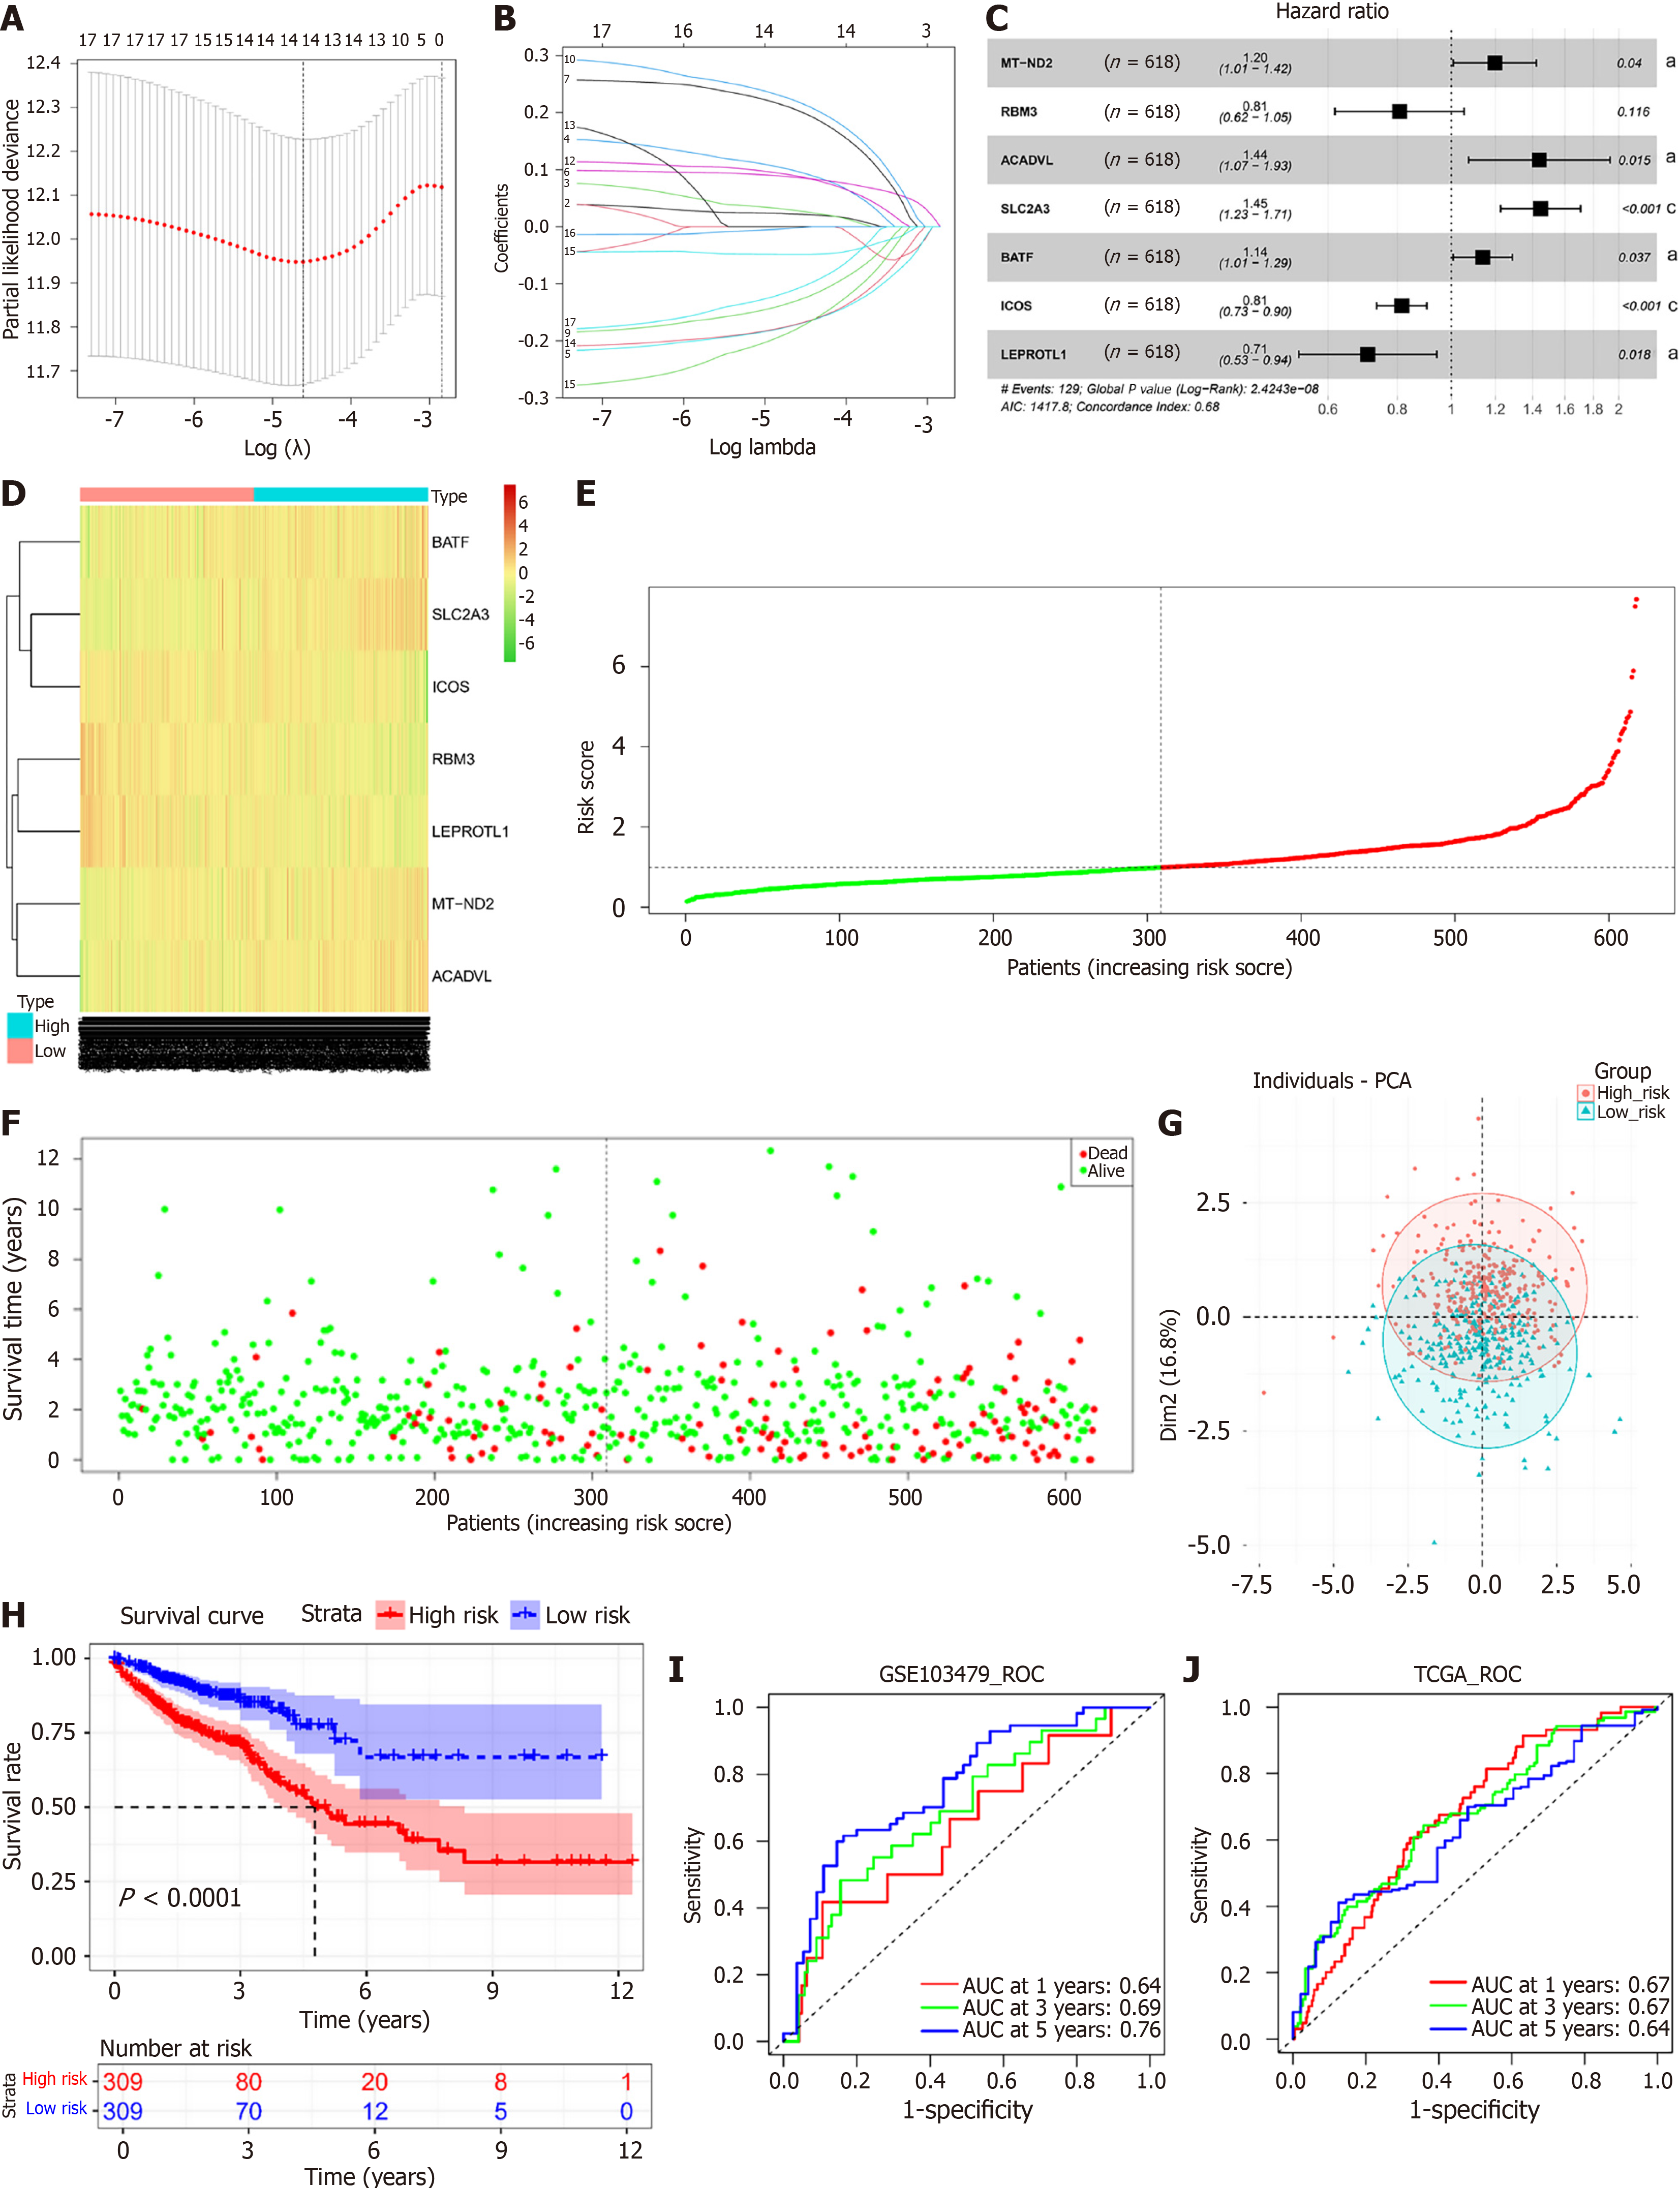
Figure 3 Prognostic modeling of lactate metabolism characteristics in colorectal cancer.
A: Screening for the optimal penalty parameter (λ) in LASSO Cox analysis; B: Coefficients of genes in LASSO Cox analysis; C: Forest plot of seven independent prognostic factors; D: Heatmap of the expression levels of 7 lactate metabolism genes in the high- and low-risk score groups; E: Risk score distribution of samples in The Cancer Genome Atlas database-colon and rectal adenocarcinomas (TCGA-COADREAD) cohort; F: Scatterplot of the survival status of COADREAD patients in the TCGA-COADREAD cohort according to the risk score distribution; G: Principal component analysis distribution plot of patients with high and low risk scores based on the expression profiles of 7 genes related to lactate metabolism; H: Kaplan-Meier survival curves of patients in the TCGA-COADREAD cohort with high and low risk scores; I: Receiver operating characteristic curves of patients in the TCGA-COADREAD cohort with the risk score for predicting 1-, 3-, and 5-year survival; J: Receiver operating characteristic curves for the risk score for predicting patient survival at 1, 3, and 5 years in the GSE103479 cohort. aP < 0.05, cP < 0.001. MT-ND2: Mitochondrial-dihydronicotinamide adenine dinucleotide dehydrogenase subunit 2; RBM3: RNA binding motif protein 3; ACADVL: Acyl-CoA dehydrogenase very-long-chain; SLC2A3: Solute carrier family 2 member 3; BATF: Basic leucine zipper transcription factor ATF-like; ICOS: Inducible T cell costimulator; LEPROTL1: Leptin receptor overlapping transcript-like 1; PCA: Principal component analysis; ROC: Receiver operating characteristic; AUC: Area under the curve; TCGA: The Cancer Genome Atlas database.
- Citation: Wang XP, Zhu JX, Liu C, Zhang HW, Sun GD, Zhai JM, Yang HJ, Liu DC. Deciphering lactate metabolism in colorectal cancer: Prognostic modeling, immune infiltration, and gene mutation insights. World J Gastroenterol 2025; 31(25): 107478
- URL: https://www.wjgnet.com/1007-9327/full/v31/i25/107478.htm
- DOI: https://dx.doi.org/10.3748/wjg.v31.i25.107478


