Copyright
©The Author(s) 2025.
World J Gastroenterol. Jul 7, 2025; 31(25): 107478
Published online Jul 7, 2025. doi: 10.3748/wjg.v31.i25.107478
Published online Jul 7, 2025. doi: 10.3748/wjg.v31.i25.107478
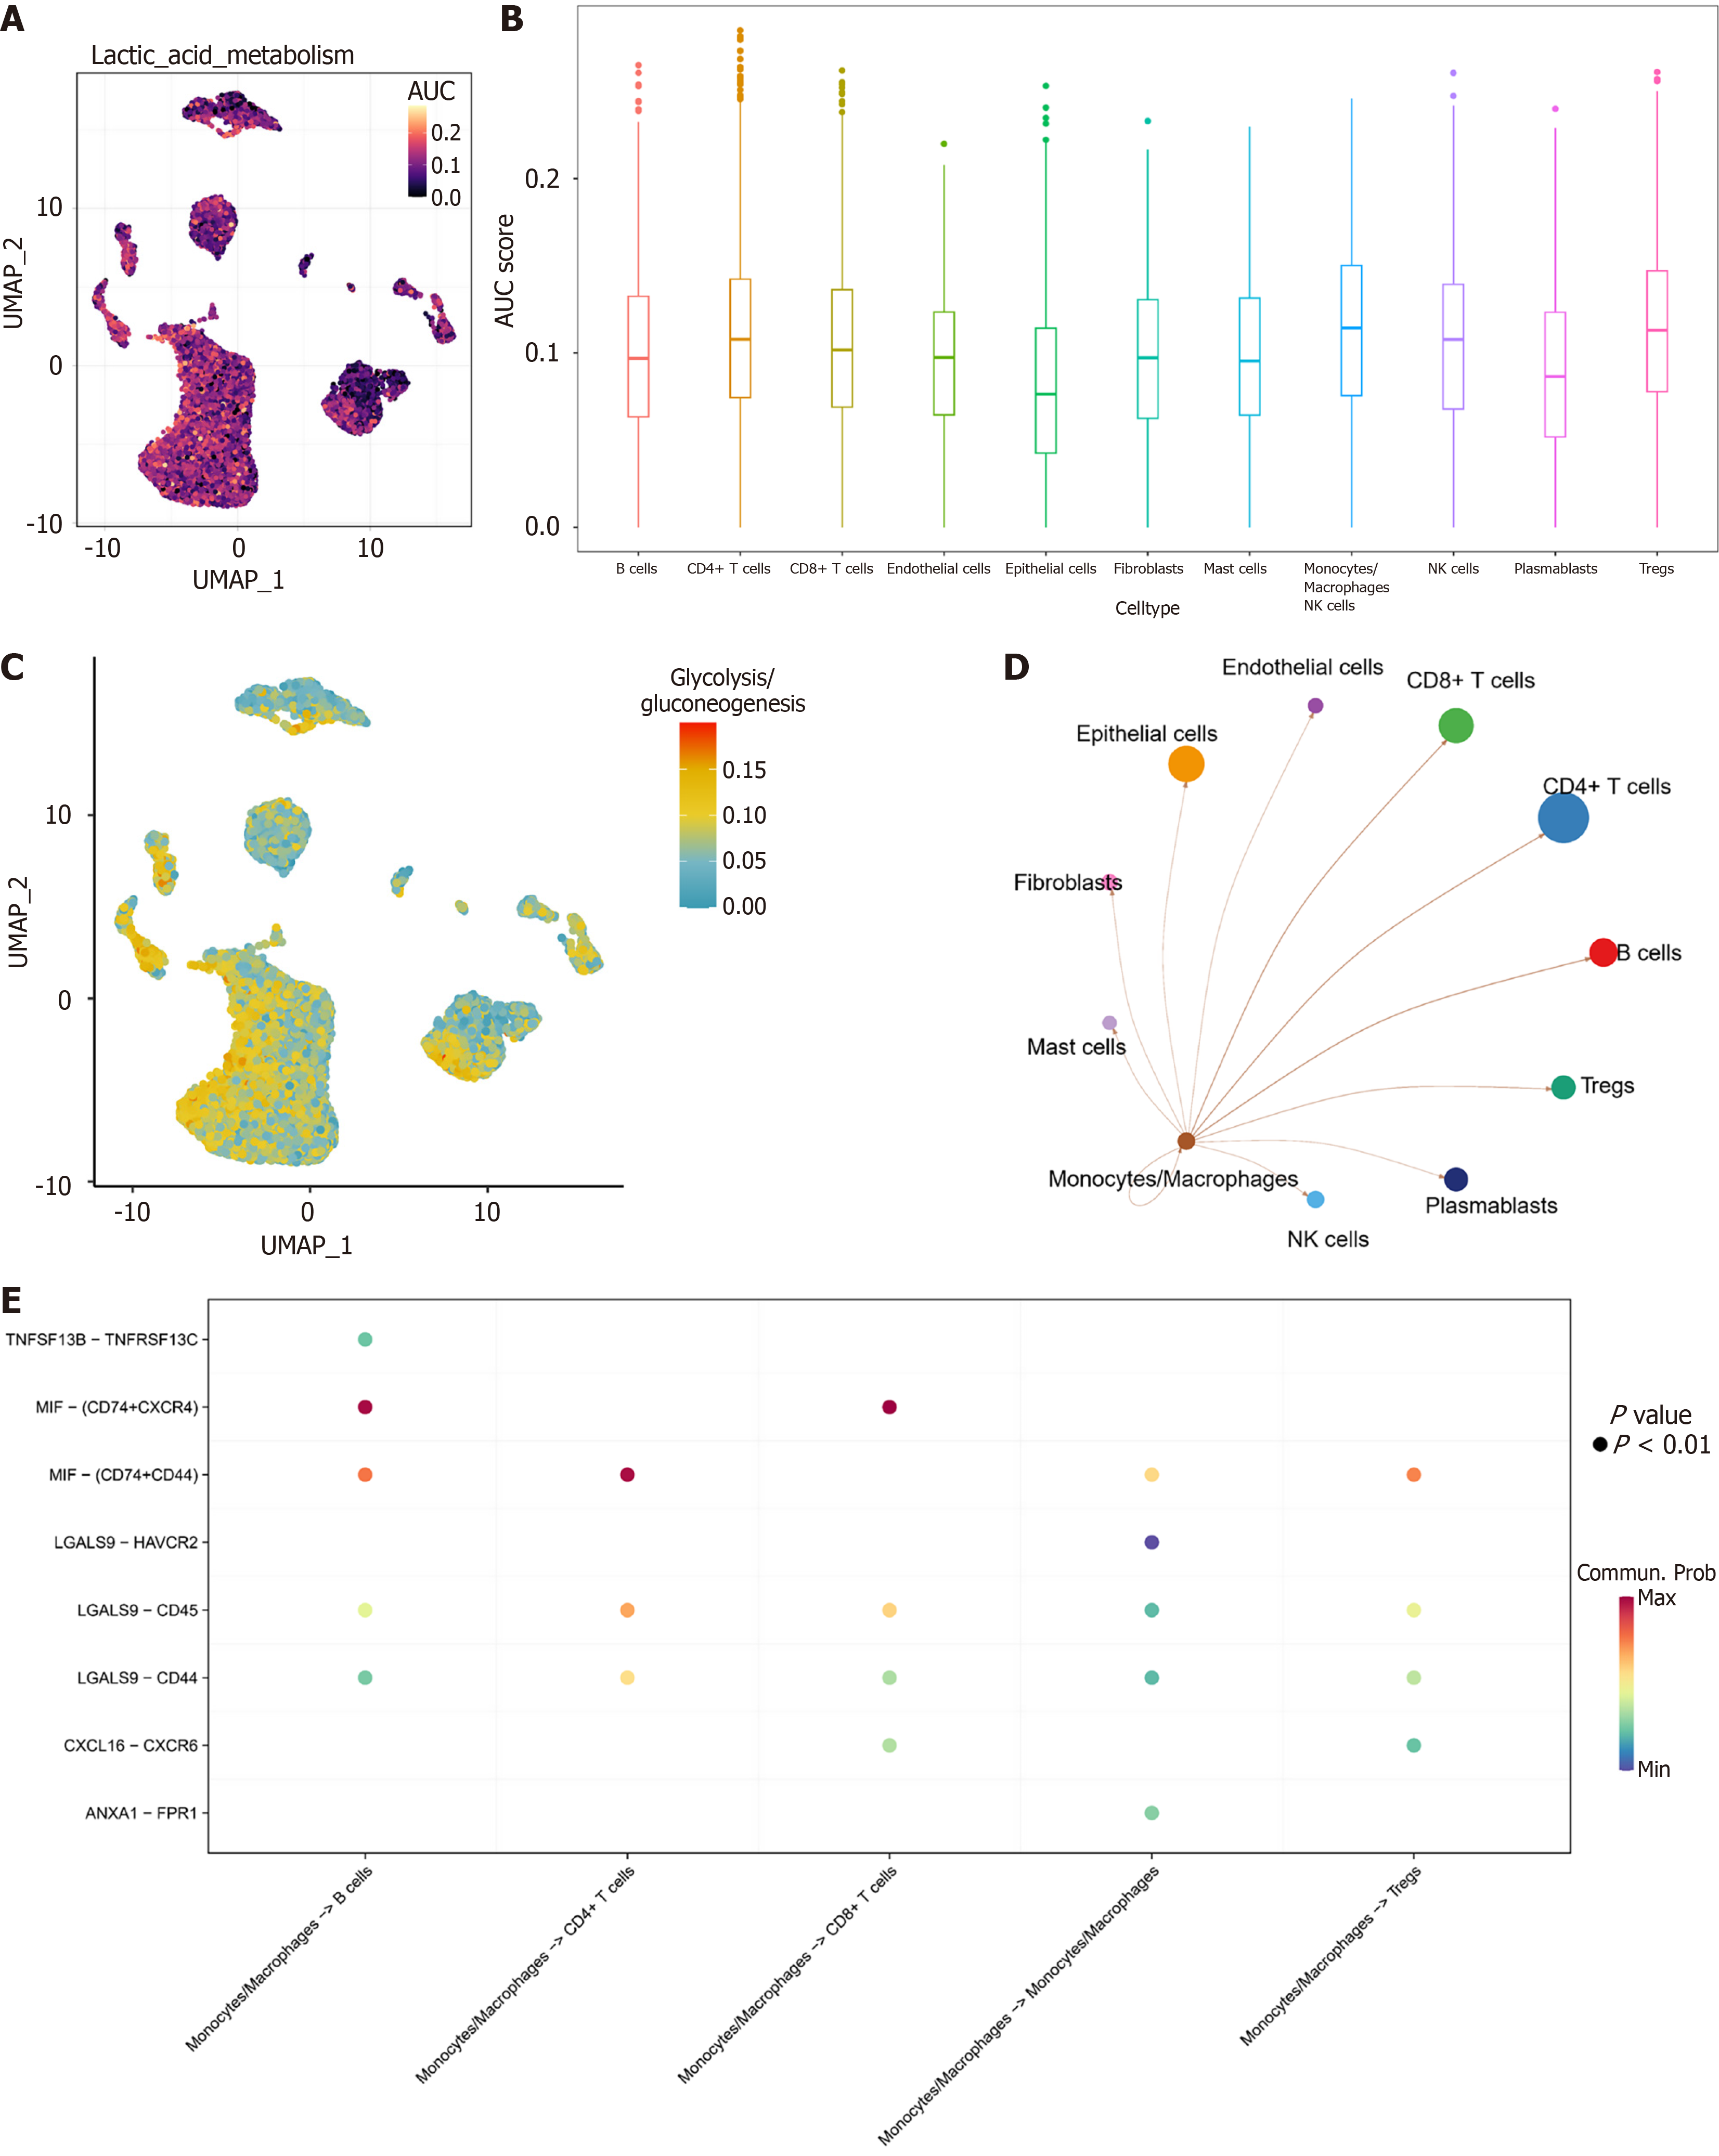
Figure 2 Monocytes/macrophages exhibit high lactate metabolic activity.
A: Uniform manifold approximation and projection heatmap of lactate metabolic activity in 11 cell subpopulations; B: Boxplot of lactate metabolic activity in 11 cell subpopulations; C: Uniform manifold approximation and projection heatmap of glycolysis/gluconeogenesis pathway activity in 11 cellular subpopulations; D: Cellular communication network of monocytes/macrophages with the remaining 10 cell subpopulations; E: Ligand-receptor dot plot of monocytes/macrophages with B cells, CD4+ T cells, monocytes/macrophages, and regulatory T cells. UMAP: Uniform manifold approximation and projection; AUC: Area under the curve; NK: Natural killer; TNFSF: Tumor necrosis factor superfamily member; TNFRSF: Tumor necrosis factor receptor superfamily; MIF: Migration inhibitory factor; CXCR4: C-X-C motif chemokine receptor-4; ANXA: Annexin A.
- Citation: Wang XP, Zhu JX, Liu C, Zhang HW, Sun GD, Zhai JM, Yang HJ, Liu DC. Deciphering lactate metabolism in colorectal cancer: Prognostic modeling, immune infiltration, and gene mutation insights. World J Gastroenterol 2025; 31(25): 107478
- URL: https://www.wjgnet.com/1007-9327/full/v31/i25/107478.htm
- DOI: https://dx.doi.org/10.3748/wjg.v31.i25.107478


