Copyright
©The Author(s) 2025.
World J Gastroenterol. Jul 7, 2025; 31(25): 107478
Published online Jul 7, 2025. doi: 10.3748/wjg.v31.i25.107478
Published online Jul 7, 2025. doi: 10.3748/wjg.v31.i25.107478
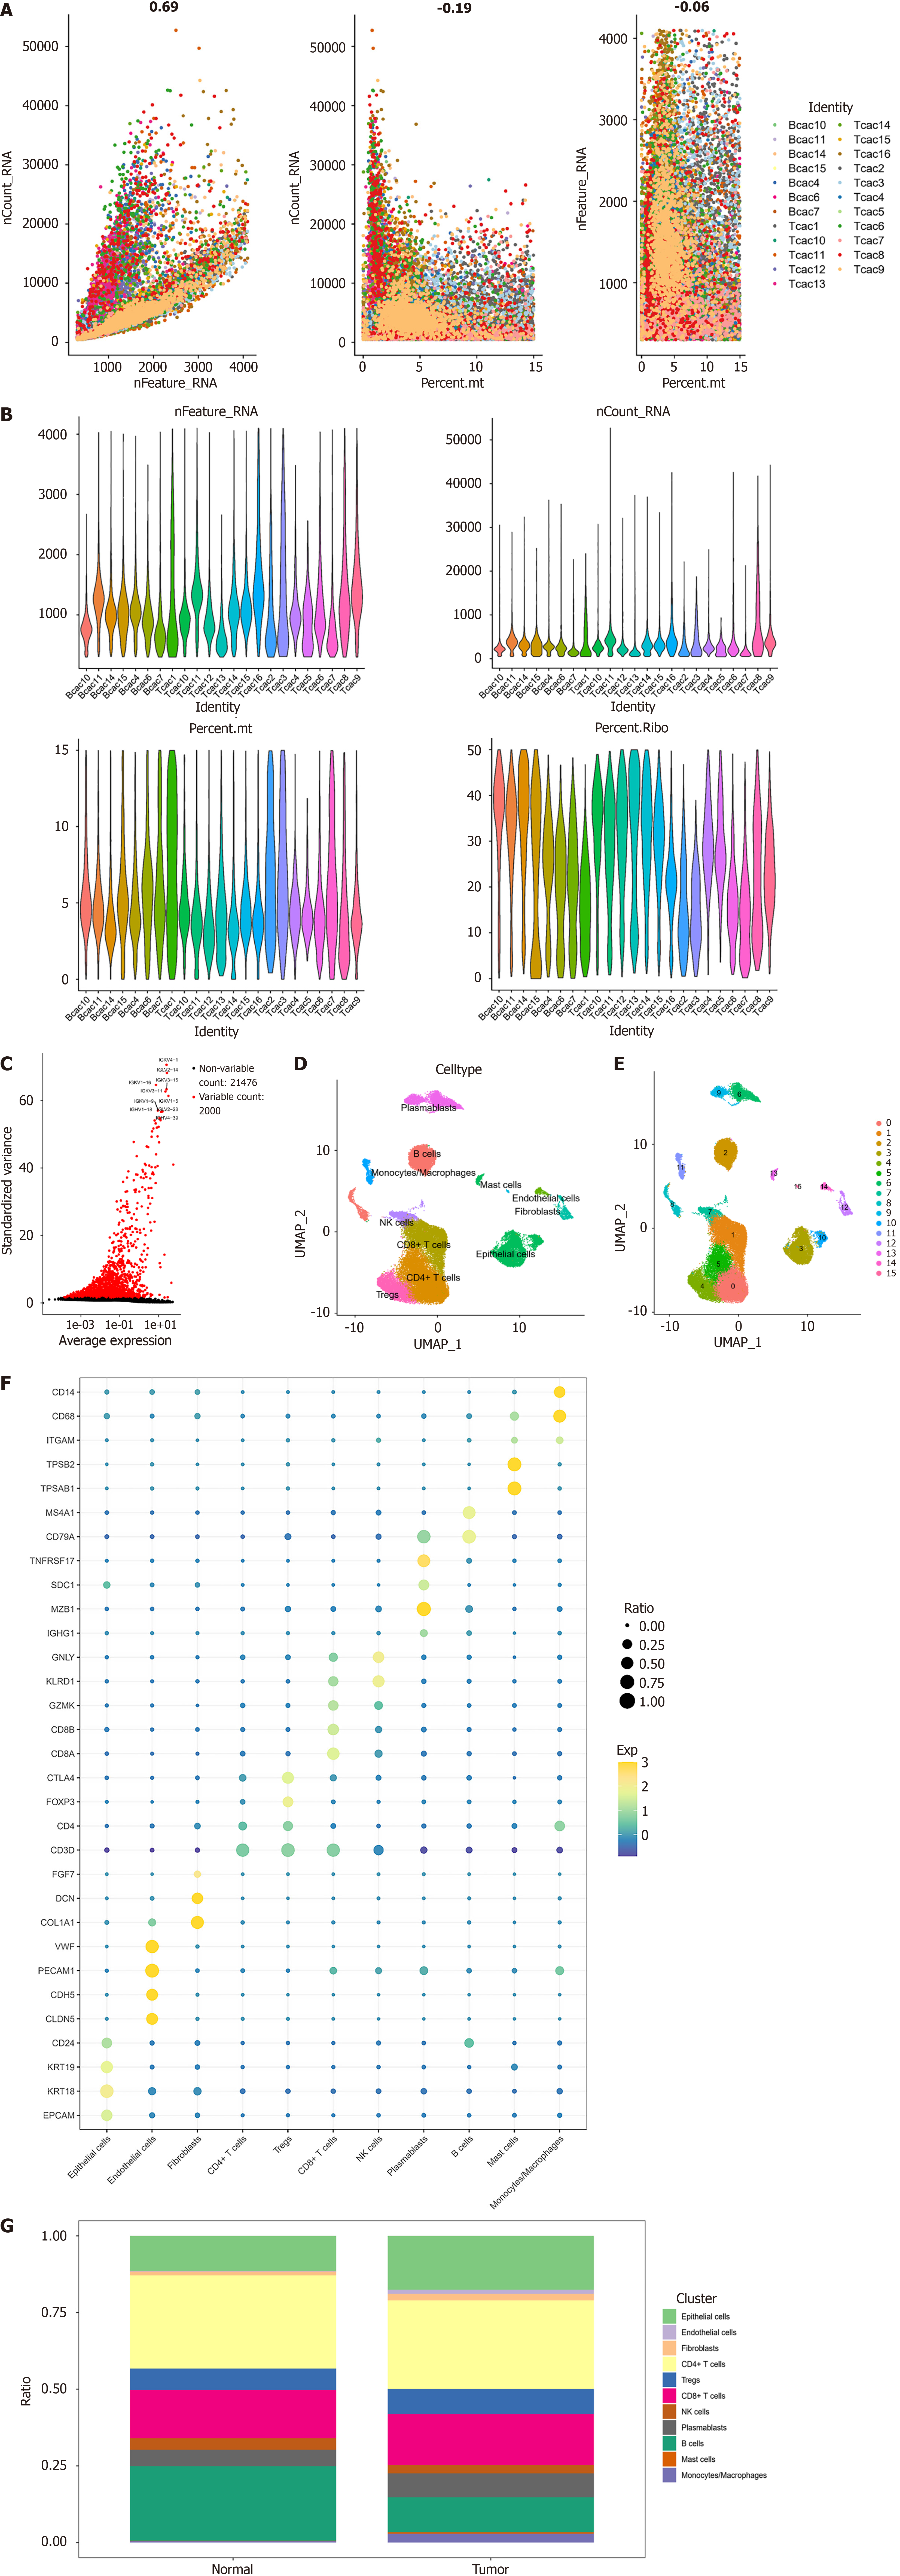
Figure 1 Cell mapping in colorectal cancer.
A: Plot of RNA feature counts (nFeature_RNA) vs total RNA abundance (nCount_RNA) correlation after quality control (QC); plot of nCount_RNA vs mitochondrial percentage after QC; plot of nFeature_RNA vs mitochondrial percentage after QC; B: Violin plots of nFeature_RNA, nCount_RNA, mitochondrial gene percentage, and erythrocyte gene percentage for each sample after QC; C: Volcano plot of highly variable genes. The graph shows 23476 genes in all cells; red dots indicate highly variable genes, and the top 10 most variable genes are labeled in the graph; D: Uniform manifold approximation and projection distribution map of 16 cell clusters identified after cluster analysis and dimensionality reduction analysis; E: Uniform manifold approximation and projection distribution map of 11 cell subclusters identified after annotation; F: Expression bubble plots of marker genes in 11 cell subgroups; G: Ratio of the 11 cell subpopulations in tumor tissues and normal tissues. nFeature_RNA: RNA feature counts; nCount_RNA: Total RNA abundance; UMAP: Uniform manifold approximation and projection; NK: Natural killer.
- Citation: Wang XP, Zhu JX, Liu C, Zhang HW, Sun GD, Zhai JM, Yang HJ, Liu DC. Deciphering lactate metabolism in colorectal cancer: Prognostic modeling, immune infiltration, and gene mutation insights. World J Gastroenterol 2025; 31(25): 107478
- URL: https://www.wjgnet.com/1007-9327/full/v31/i25/107478.htm
- DOI: https://dx.doi.org/10.3748/wjg.v31.i25.107478


