Copyright
©The Author(s) 2025.
World J Gastroenterol. Jun 21, 2025; 31(23): 106949
Published online Jun 21, 2025. doi: 10.3748/wjg.v31.i23.106949
Published online Jun 21, 2025. doi: 10.3748/wjg.v31.i23.106949
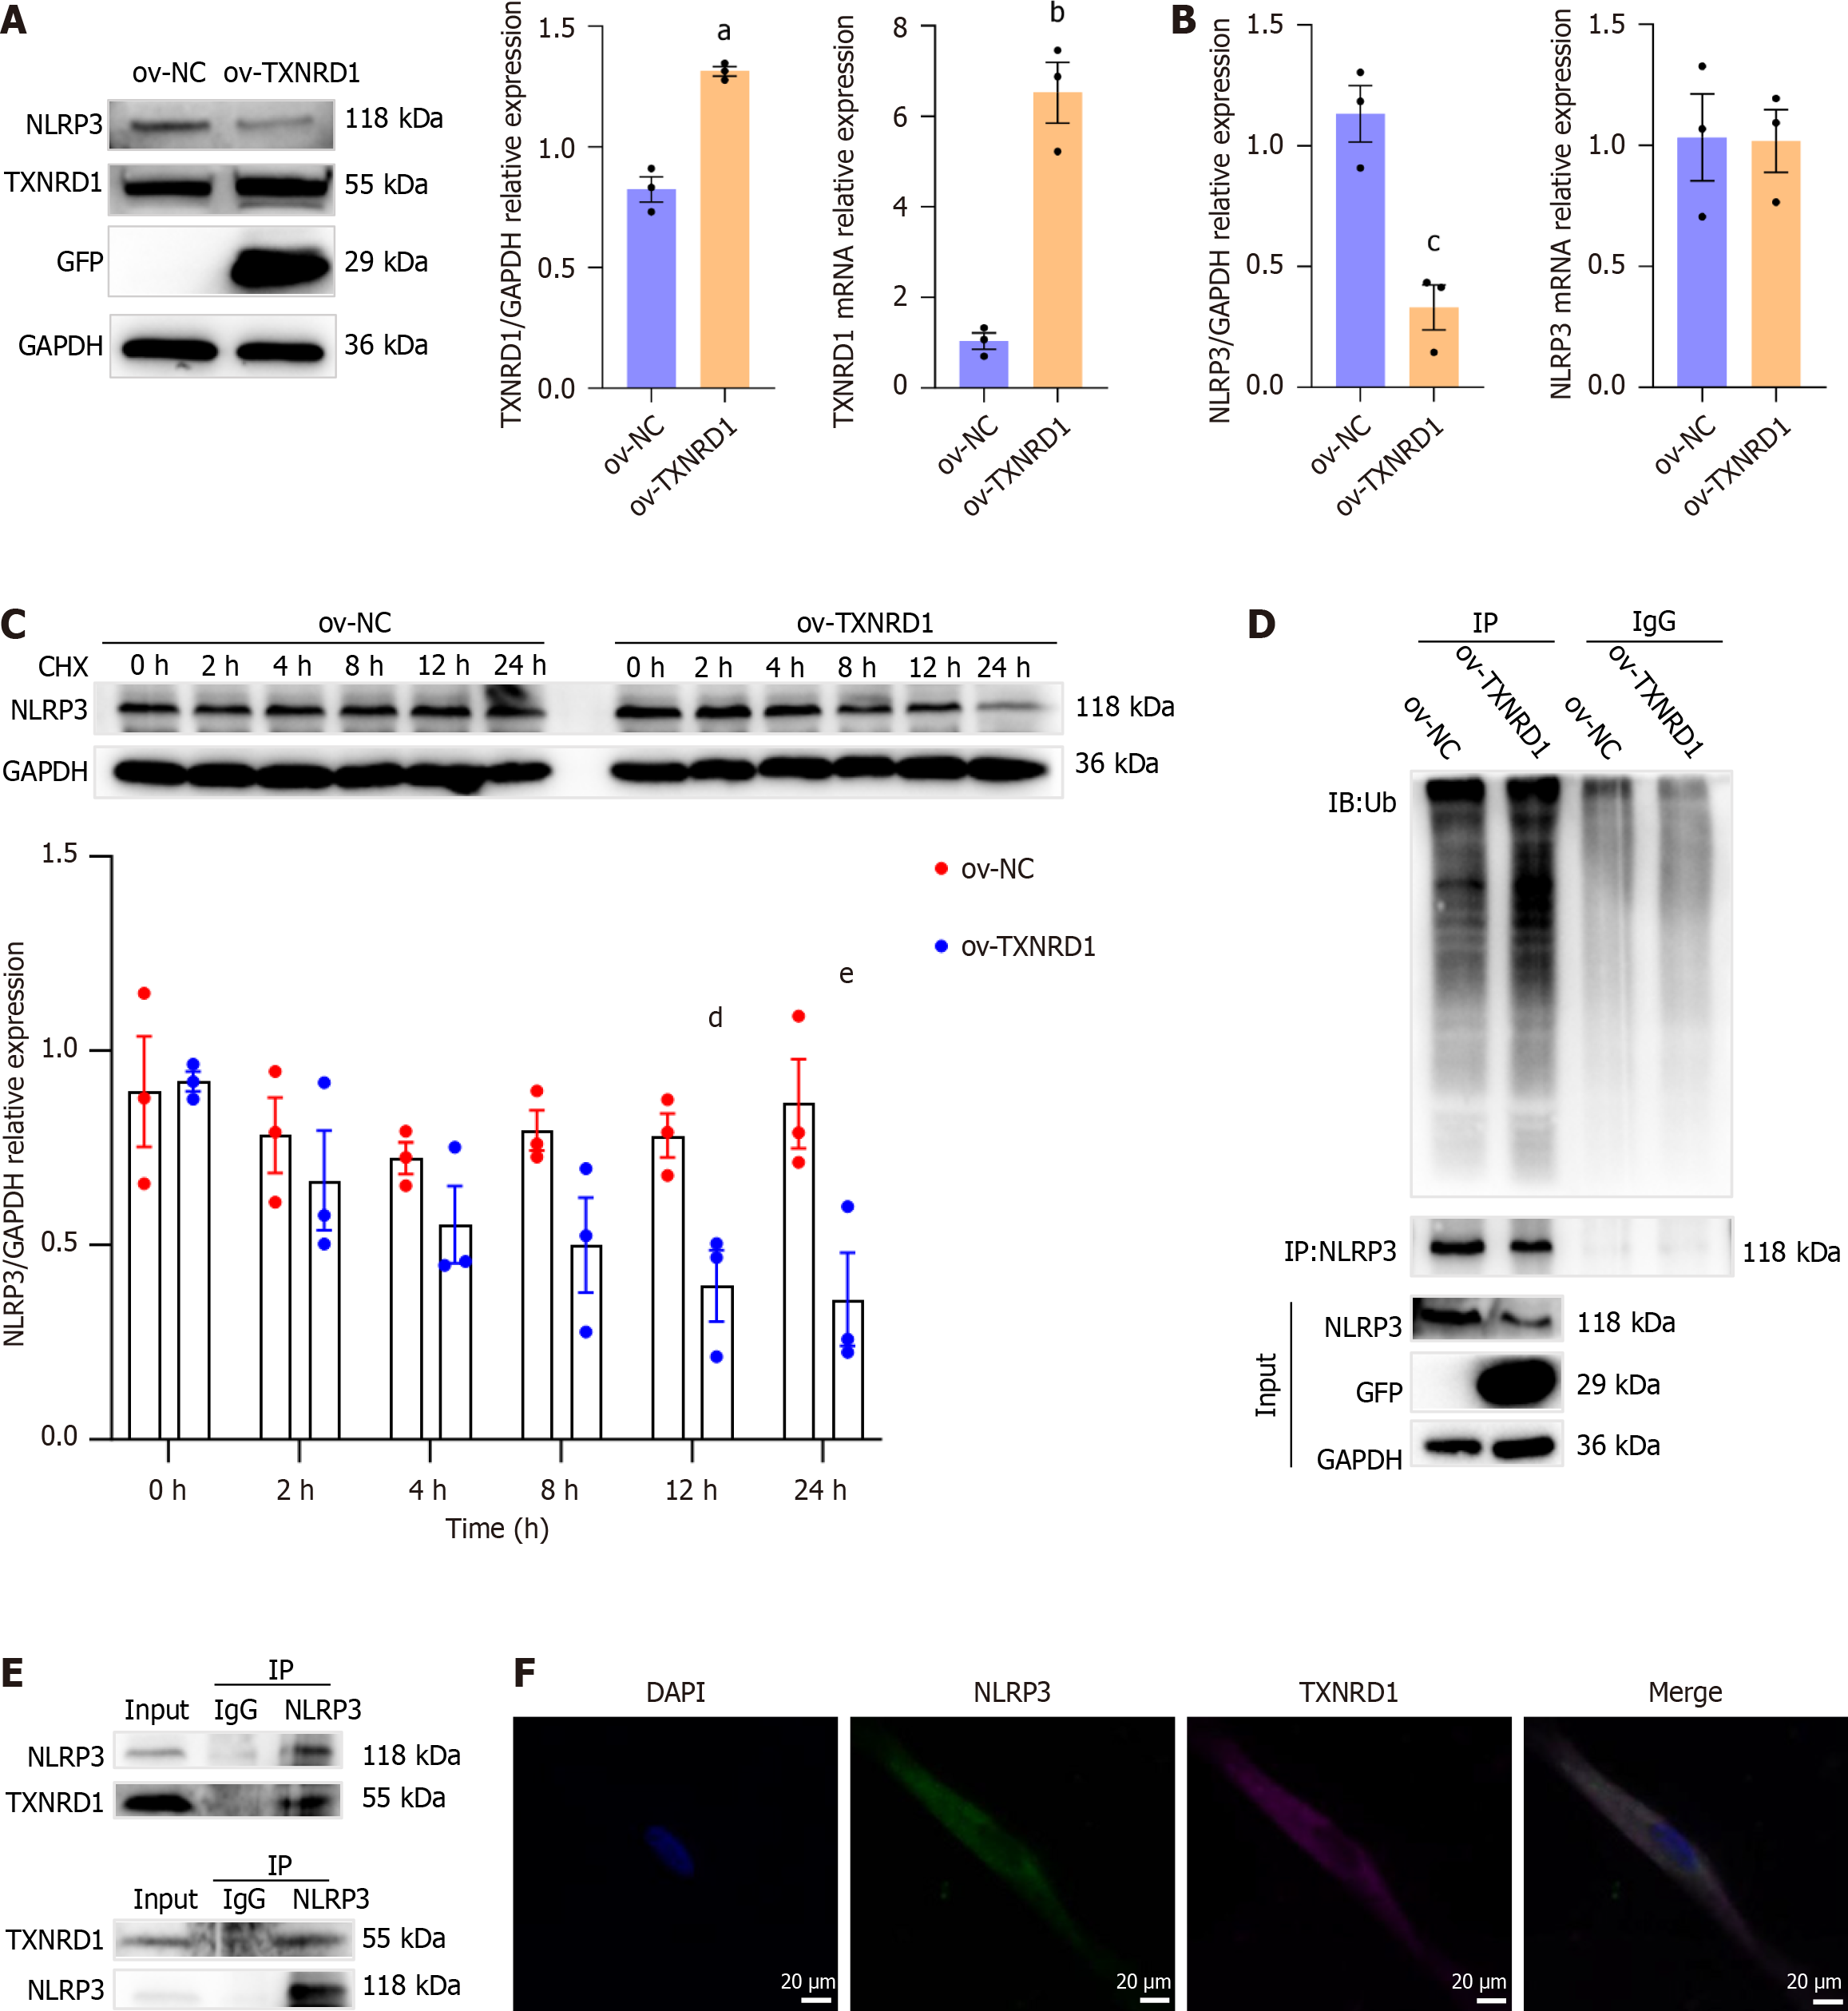
Figure 9 Thioredoxin reductase 1 and NLR family pyrin domain containing 3 interaction in primary rat esophageal fibroblasts.
Data presented as mean ± SE). Statistical analysis was performed using the Student’s t test. A: Western blot analysis of thioredoxin reductase 1 (TXNRD1) and NLR family pyrin domain containing 3 (NLRP3) in the control and TXNRD1-overexpression cells, aP < 0.001; bP = 0.001; B: mRNA and protein levels of NLRP3 in the control and TXNRD1-overexpression groups, cP = 0.006; C: Western blot analysis of NLRP3 in the control and TXNRD1-overexpression groups after incubation with CHX (10 μM) for 0, 2, 4, 8, 12 and 24 hours, dP = 0.02; eP = 0.02; D: Protein levels of NLRP3 ubiquitination in primary rat esophageal fibroblasts (REFs) from the control and TXNRD1-overexpression groups following MG132 (5 μM) treatment for 6 hours (n = 3 in each group); E: Reciprocal co-immunoprecipitation assays showing the TXNRD1-NLRP3 interaction with endogenous proteins in primary REFs (n = 3 in each group); F: Colocalization of TXNRD1 and NLRP3 observed under a fluorescence microscope. Scale bar = 20 μm. NLRP3: NLR family pyrin domain containing 3; CEL: Celastrol; PRED: Prednisolone; LPS: Lipopolysaccharide; TXNRD1: Thioredoxin reductase 1; NC: Negative control.
- Citation: Zhang MX, Wu C, Feng XX, Tian W, Zhao NH, Lu PP, Ding Q, Liu M. Celastrol alleviates esophageal stricture in rats by inhibiting NLR family pyrin domain containing 3 activation. World J Gastroenterol 2025; 31(23): 106949
- URL: https://www.wjgnet.com/1007-9327/full/v31/i23/106949.htm
- DOI: https://dx.doi.org/10.3748/wjg.v31.i23.106949


