Copyright
©The Author(s) 2025.
World J Gastroenterol. Jun 21, 2025; 31(23): 106949
Published online Jun 21, 2025. doi: 10.3748/wjg.v31.i23.106949
Published online Jun 21, 2025. doi: 10.3748/wjg.v31.i23.106949
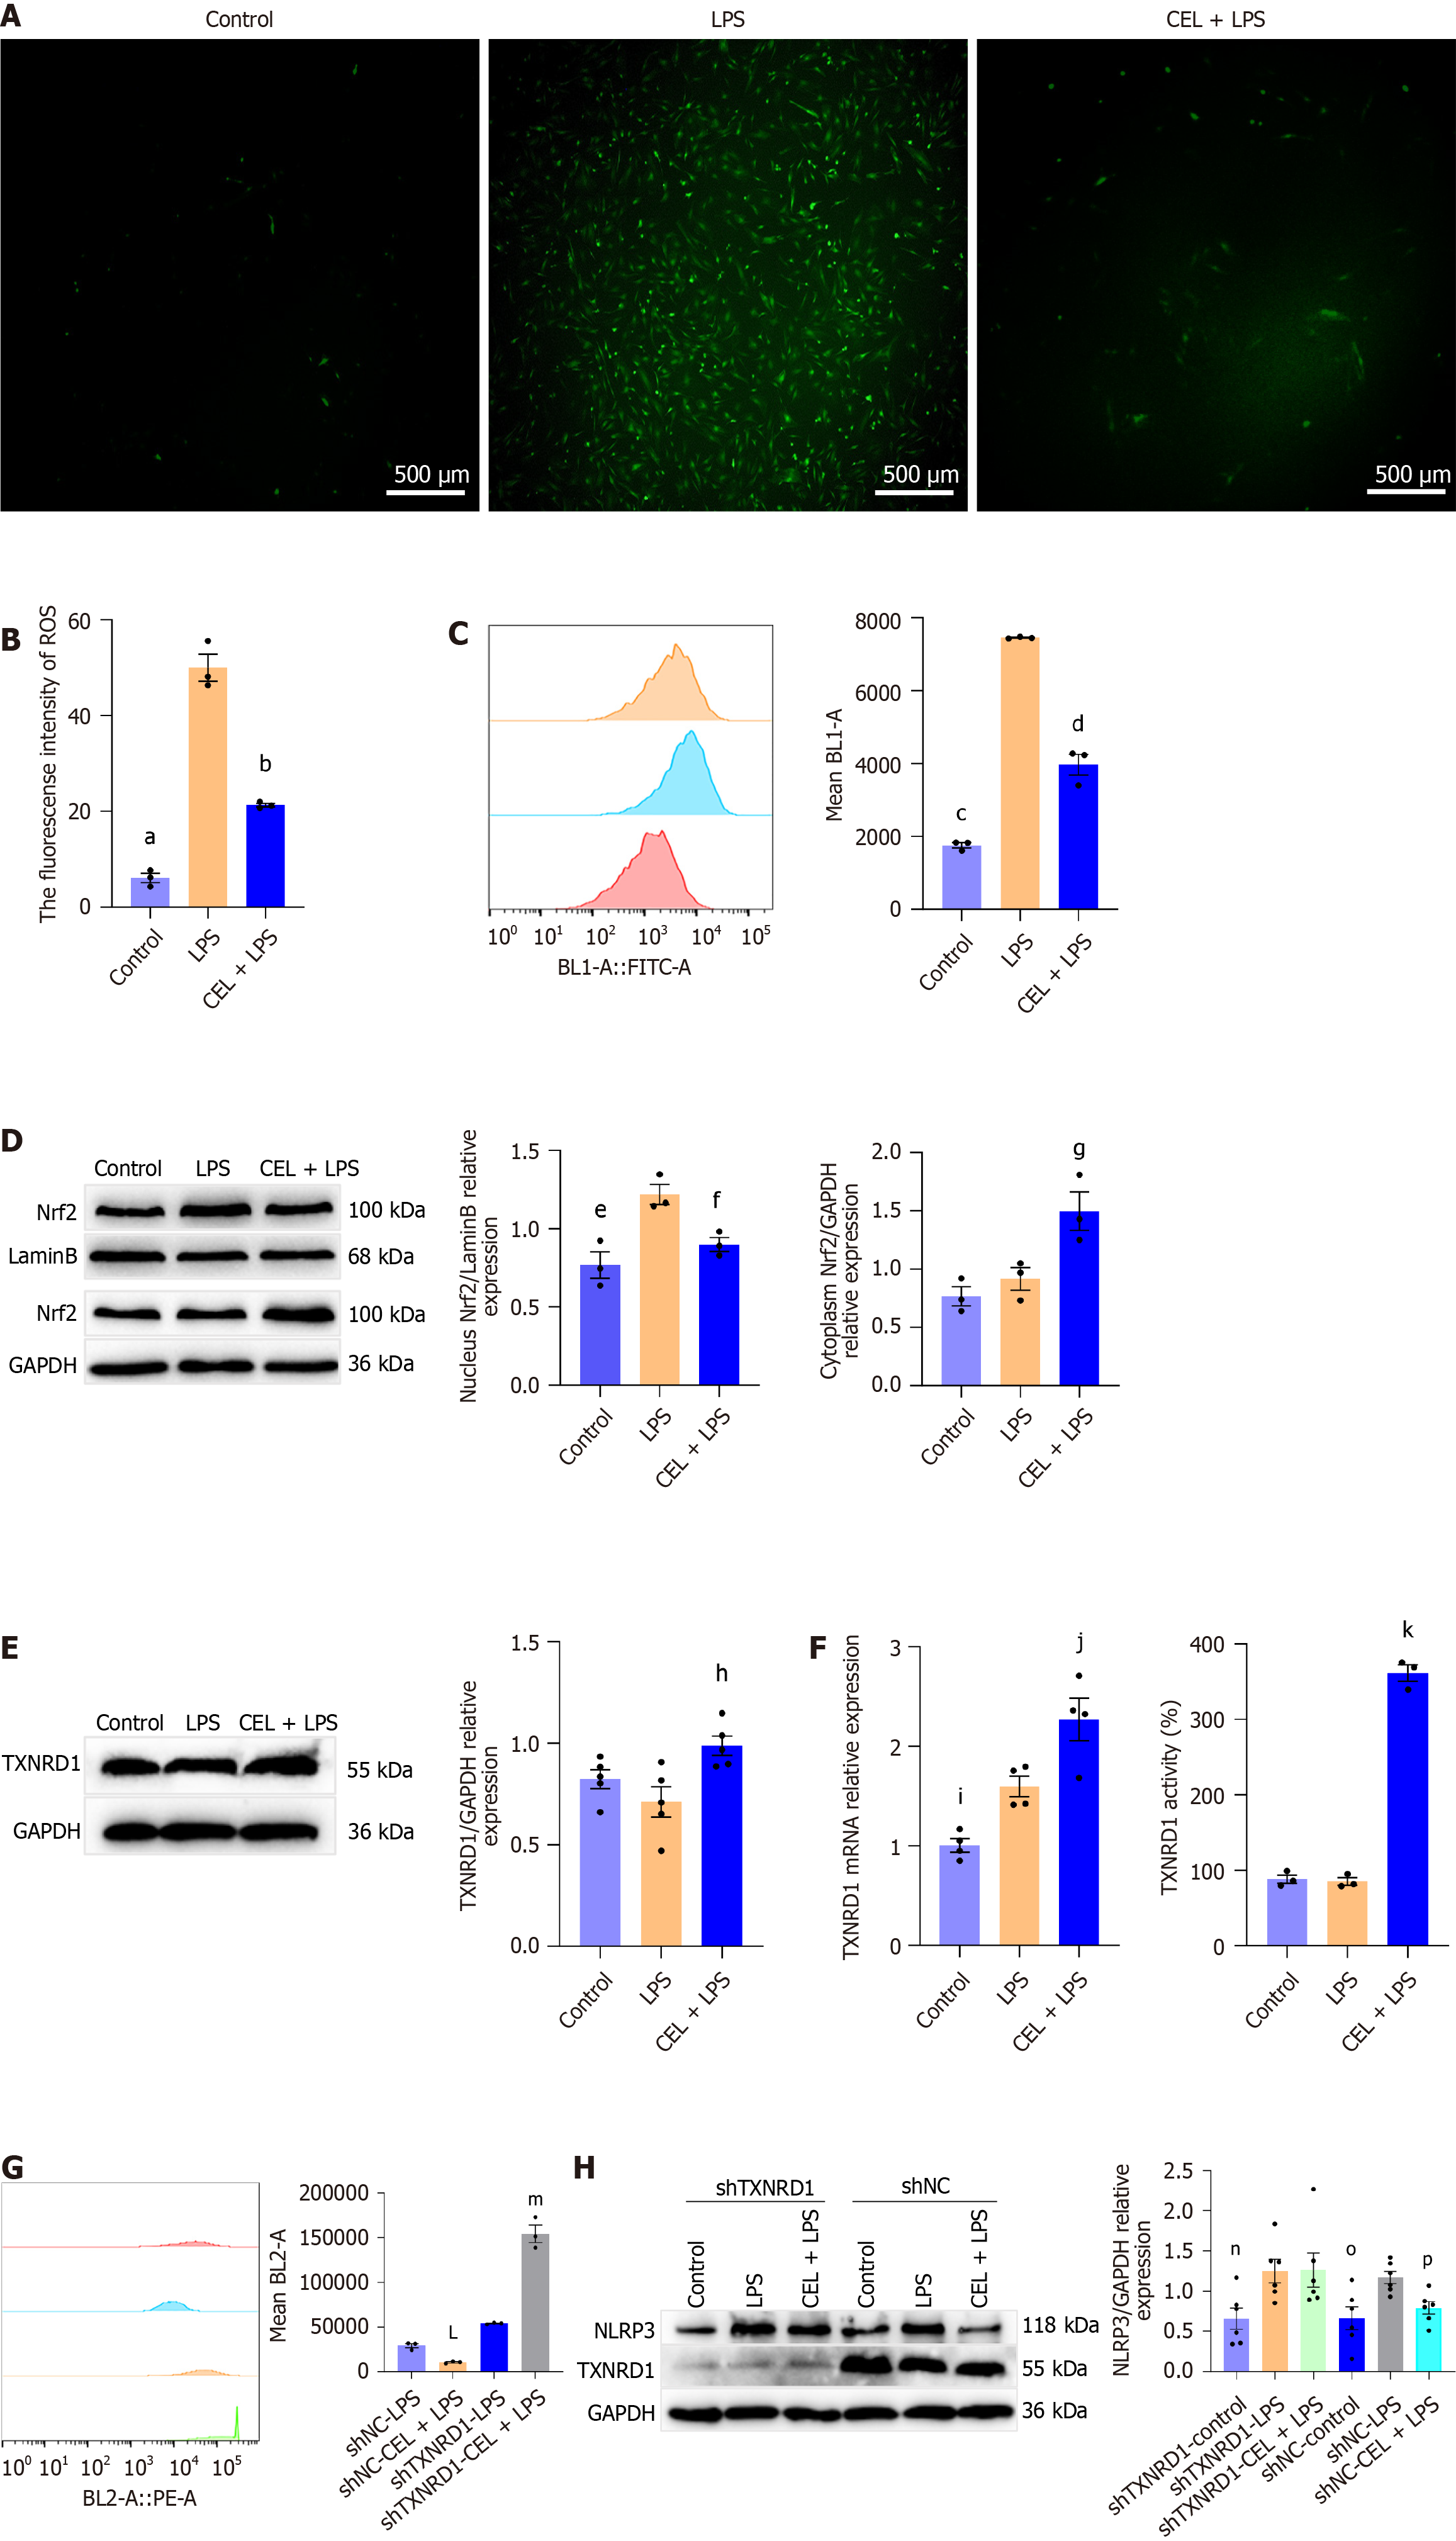
Figure 8 The effect of celastrol on the thioredoxin reductase 1/reactive oxygen species axis.
A: Representative fluorescence image and of intracellular reactive oxygen species (ROS) production detected by DCFH-DA. Scale bar = 500 μm; B: Quantitative analysis of ROS fluorescence intensity (presented as mean ± SE). Statistical analysis was performed using Dunnett’s multiple comparison test, with the “lipopolysaccharide (LPS)” group as the control, aP < 0.001; bP < 0.001; C: Flow cytometry of ROS levels in cells. The mean value of the BL1-A channel represents the ROS production level (presented as mean ± SE). Statistical analysis was performed using Dunnett’s multiple comparison test, with the “LPS” group as the control, cP < 0.001; dP < 0.001; D: Western blot analysis of nuclear factor erythroid 2-related 2 (Nrf2) in the nucleus and cytoplasm indicates nuclear translocation (presented as mean ± SE). Statistical analysis was performed using Dunnett’s multiple comparison test, with the “LPS” group as the control, eP = 0.005; fP = 0.03; fP = 0.03; E and F: mRNA, protein expression levels, and activity of thioredoxin reductase 1 (TXNRD1) (presented as mean ± SE). Statistical analysis was performed using Dunnett’s multiple comparison test, with the “LPS” group as the control, hP = 0.01; iP = 0.03; jP = 0.02; kP < 0.001; G: Flow cytometry of ROS levels in cells transfected with shNC or TXNRD1 shRNA. The mean value of the BL2-A channel represents the ROS production level (presented as mean ± SE). Statistical analysis was performed using the Student’s t test, LP = 0.002 vs shNC-LPS; mP < 0.001 vs shTXNRD1-LPS; H: Western blot analysis of NLR family pyrin domain containing 3 protein expression level in cells with shNC or shRNA of TXNRD1 (presented as mean ± SE). Statistical analysis was performed using Dunnett’s multiple comparison test, with the “shTXNRD1-LPS” or “shNC-LPS” as the control. nP = 0.04 vs shTXNRD1-LPS; oP = 0.007 vs shNC-LPS; pP = 0.04 vs shNC-LPS. NLRP3: NLR family pyrin domain containing 3; CEL: Celastrol; PRED: Prednisolone; LPS: Lipopolysaccharide; TXNRD1: Thioredoxin reductase 1.
- Citation: Zhang MX, Wu C, Feng XX, Tian W, Zhao NH, Lu PP, Ding Q, Liu M. Celastrol alleviates esophageal stricture in rats by inhibiting NLR family pyrin domain containing 3 activation. World J Gastroenterol 2025; 31(23): 106949
- URL: https://www.wjgnet.com/1007-9327/full/v31/i23/106949.htm
- DOI: https://dx.doi.org/10.3748/wjg.v31.i23.106949


