Copyright
©The Author(s) 2025.
World J Gastroenterol. Jun 21, 2025; 31(23): 106949
Published online Jun 21, 2025. doi: 10.3748/wjg.v31.i23.106949
Published online Jun 21, 2025. doi: 10.3748/wjg.v31.i23.106949
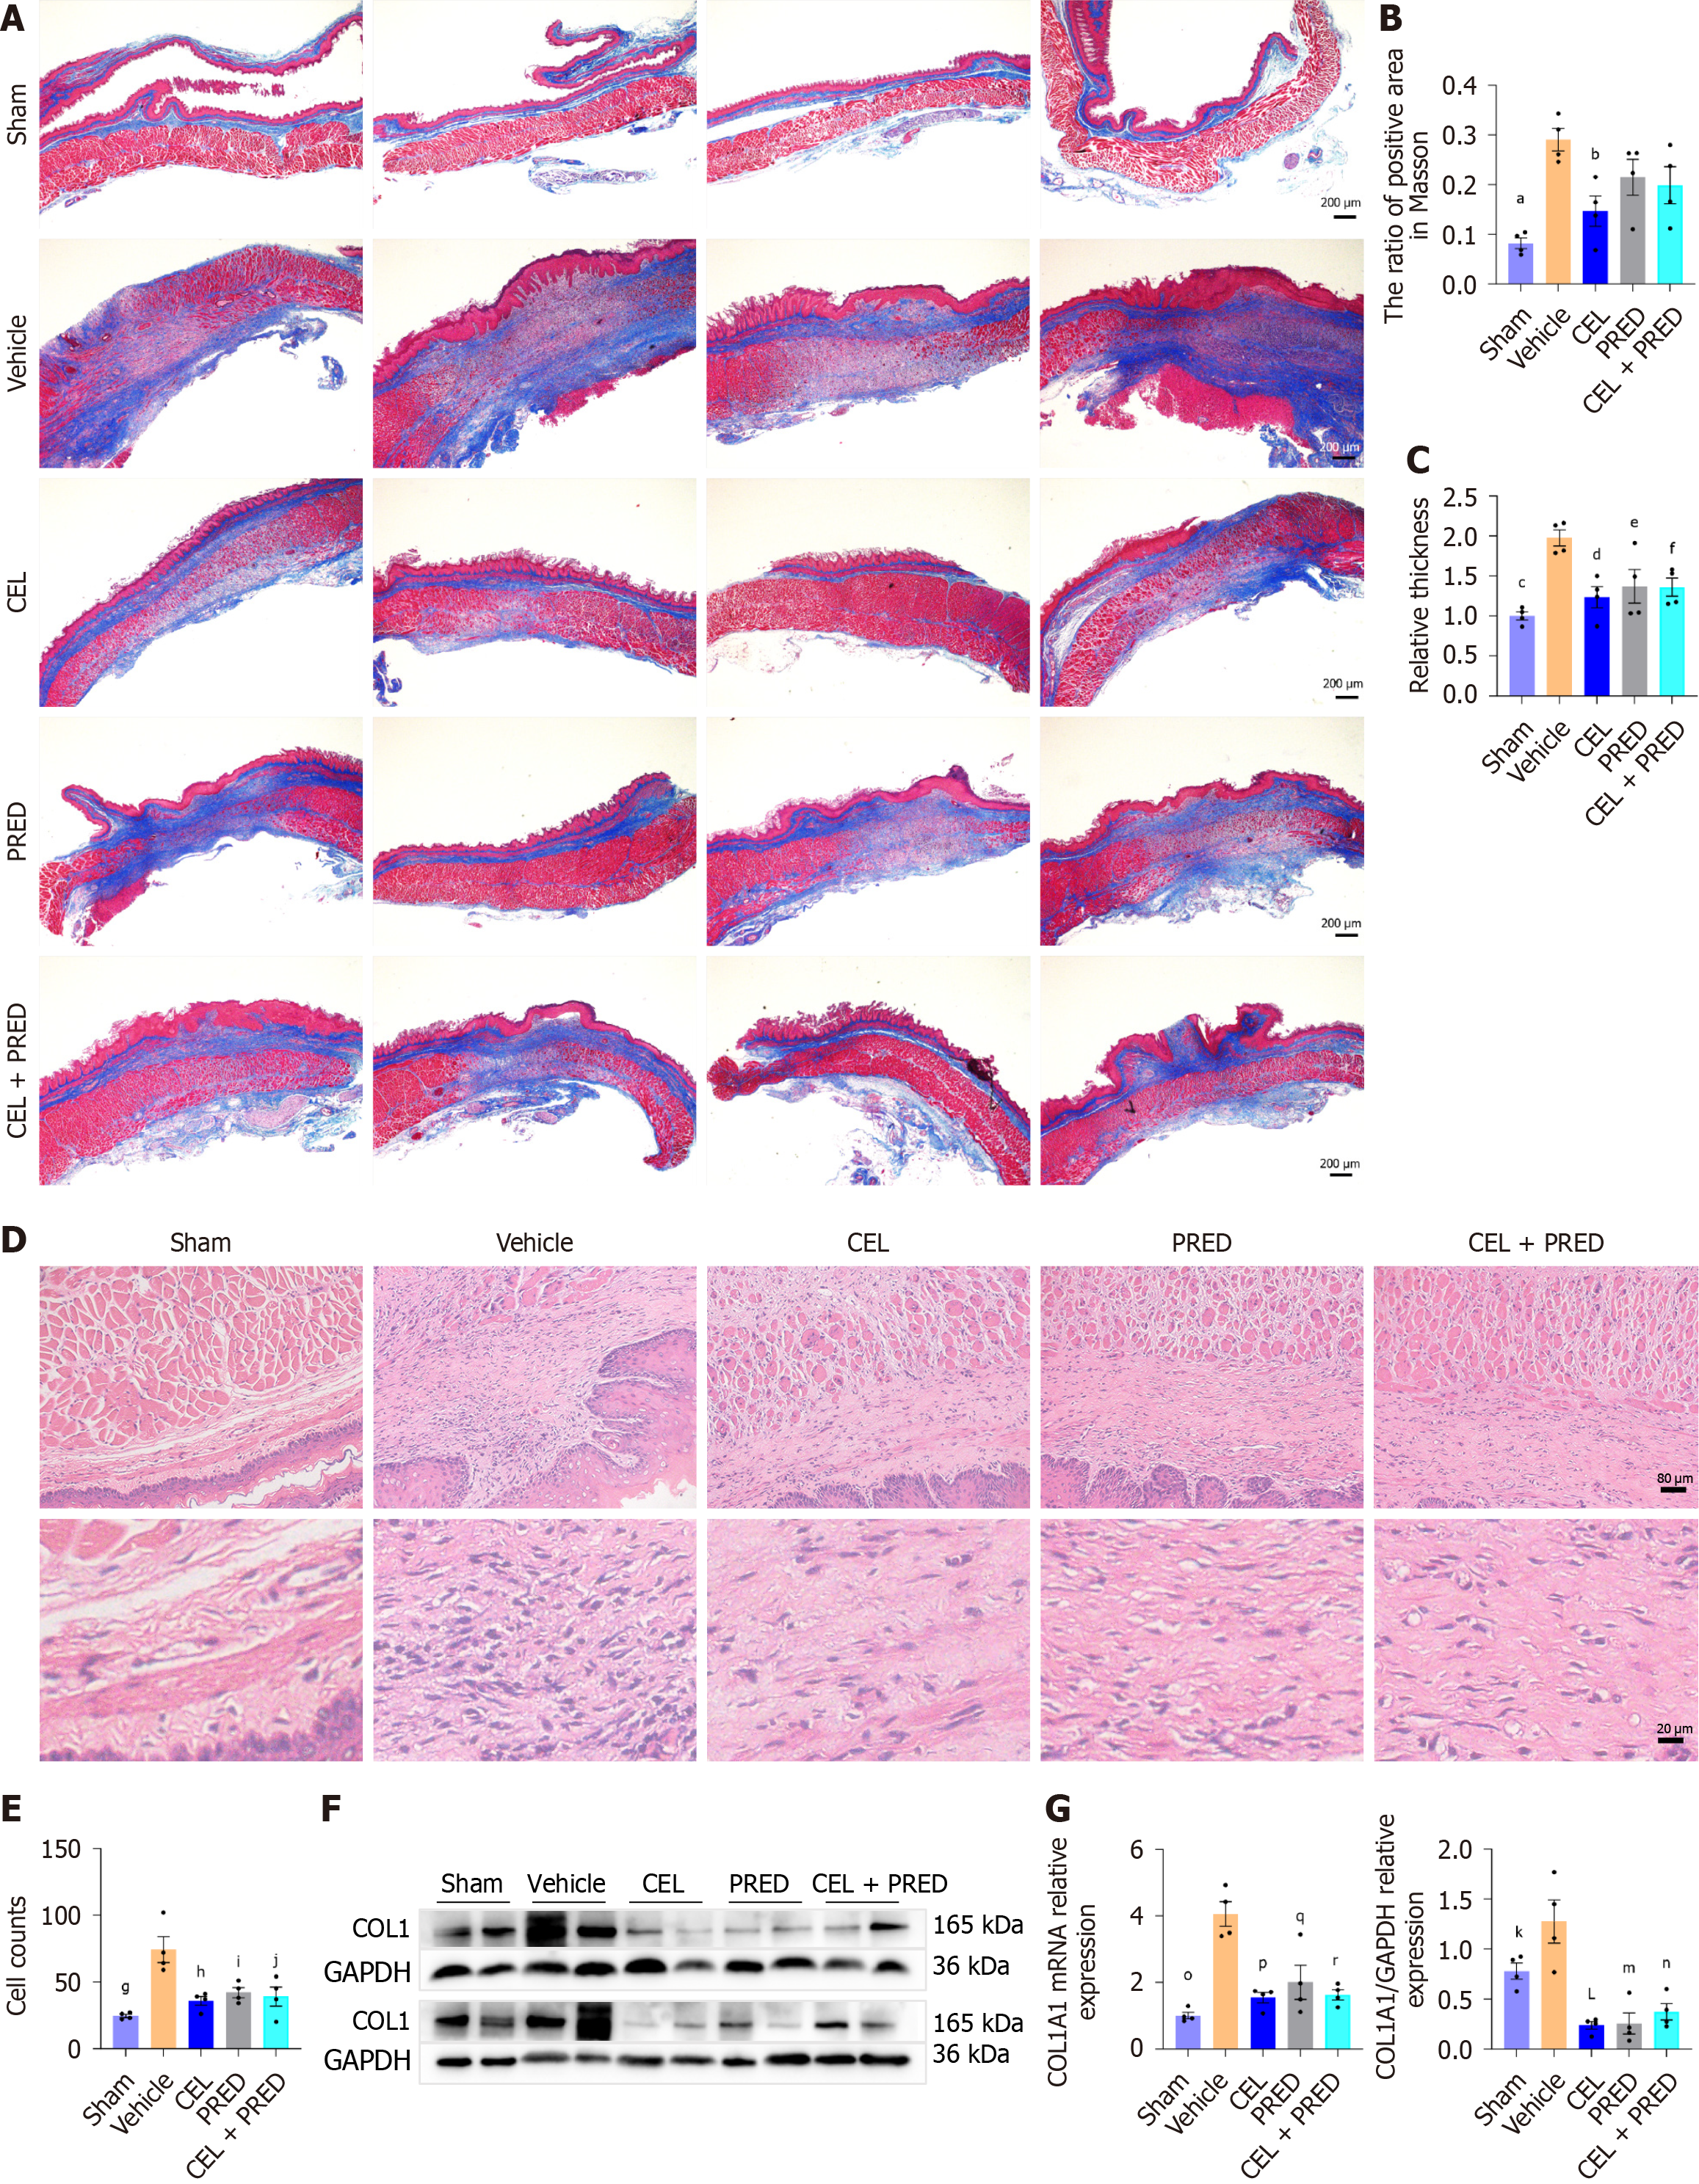
Figure 6 The effect of celastrol in preventing esophageal stricture in vivo.
Data presented as mean ± SE. Statistical analysis was performed using Dunnett’s multiple comparison test, with the “vehicle” group as the control. A: Masson staining image of the esophageal stenosis area. Scale bar = 200 μm; B: Quantitative analysis of Masson staining, aP < 0.001; bP = 0.01; C: Relative thickness of the scar area, cP < 0.001; dP = 0.004, eP = 0.02; fP = 0.02; D: Representative Hematoxylin-eosin (HE) staining image of the esophageal stenosis area in rats on day 9. Scale bar = 80 μm, 20 μm; E: Cell counts in HE staining, gP < 0.001; hP = 0.001; iP = 0.005; jP = 0.002; F: Western blot analysis of Collagen 1 (COL1) in esophageal stenosis tissues on day 9, kP = 0.04; LP < 0.001; mP < 0.001; nP < 0.001; G: mRNA levels of COL1 in esophageal stenosis tissues on day 9, oP < 0.001; pP < 0.001; qP < 0.001; rP < 0.001; NLRP3: NLR family pyrin domain containing 3; CEL: Celastrol; PRED: Prednisolone; LPS: Lipopolysaccharide.
- Citation: Zhang MX, Wu C, Feng XX, Tian W, Zhao NH, Lu PP, Ding Q, Liu M. Celastrol alleviates esophageal stricture in rats by inhibiting NLR family pyrin domain containing 3 activation. World J Gastroenterol 2025; 31(23): 106949
- URL: https://www.wjgnet.com/1007-9327/full/v31/i23/106949.htm
- DOI: https://dx.doi.org/10.3748/wjg.v31.i23.106949


