Copyright
©The Author(s) 2025.
World J Gastroenterol. Jun 14, 2025; 31(22): 108815
Published online Jun 14, 2025. doi: 10.3748/wjg.v31.i22.108815
Published online Jun 14, 2025. doi: 10.3748/wjg.v31.i22.108815
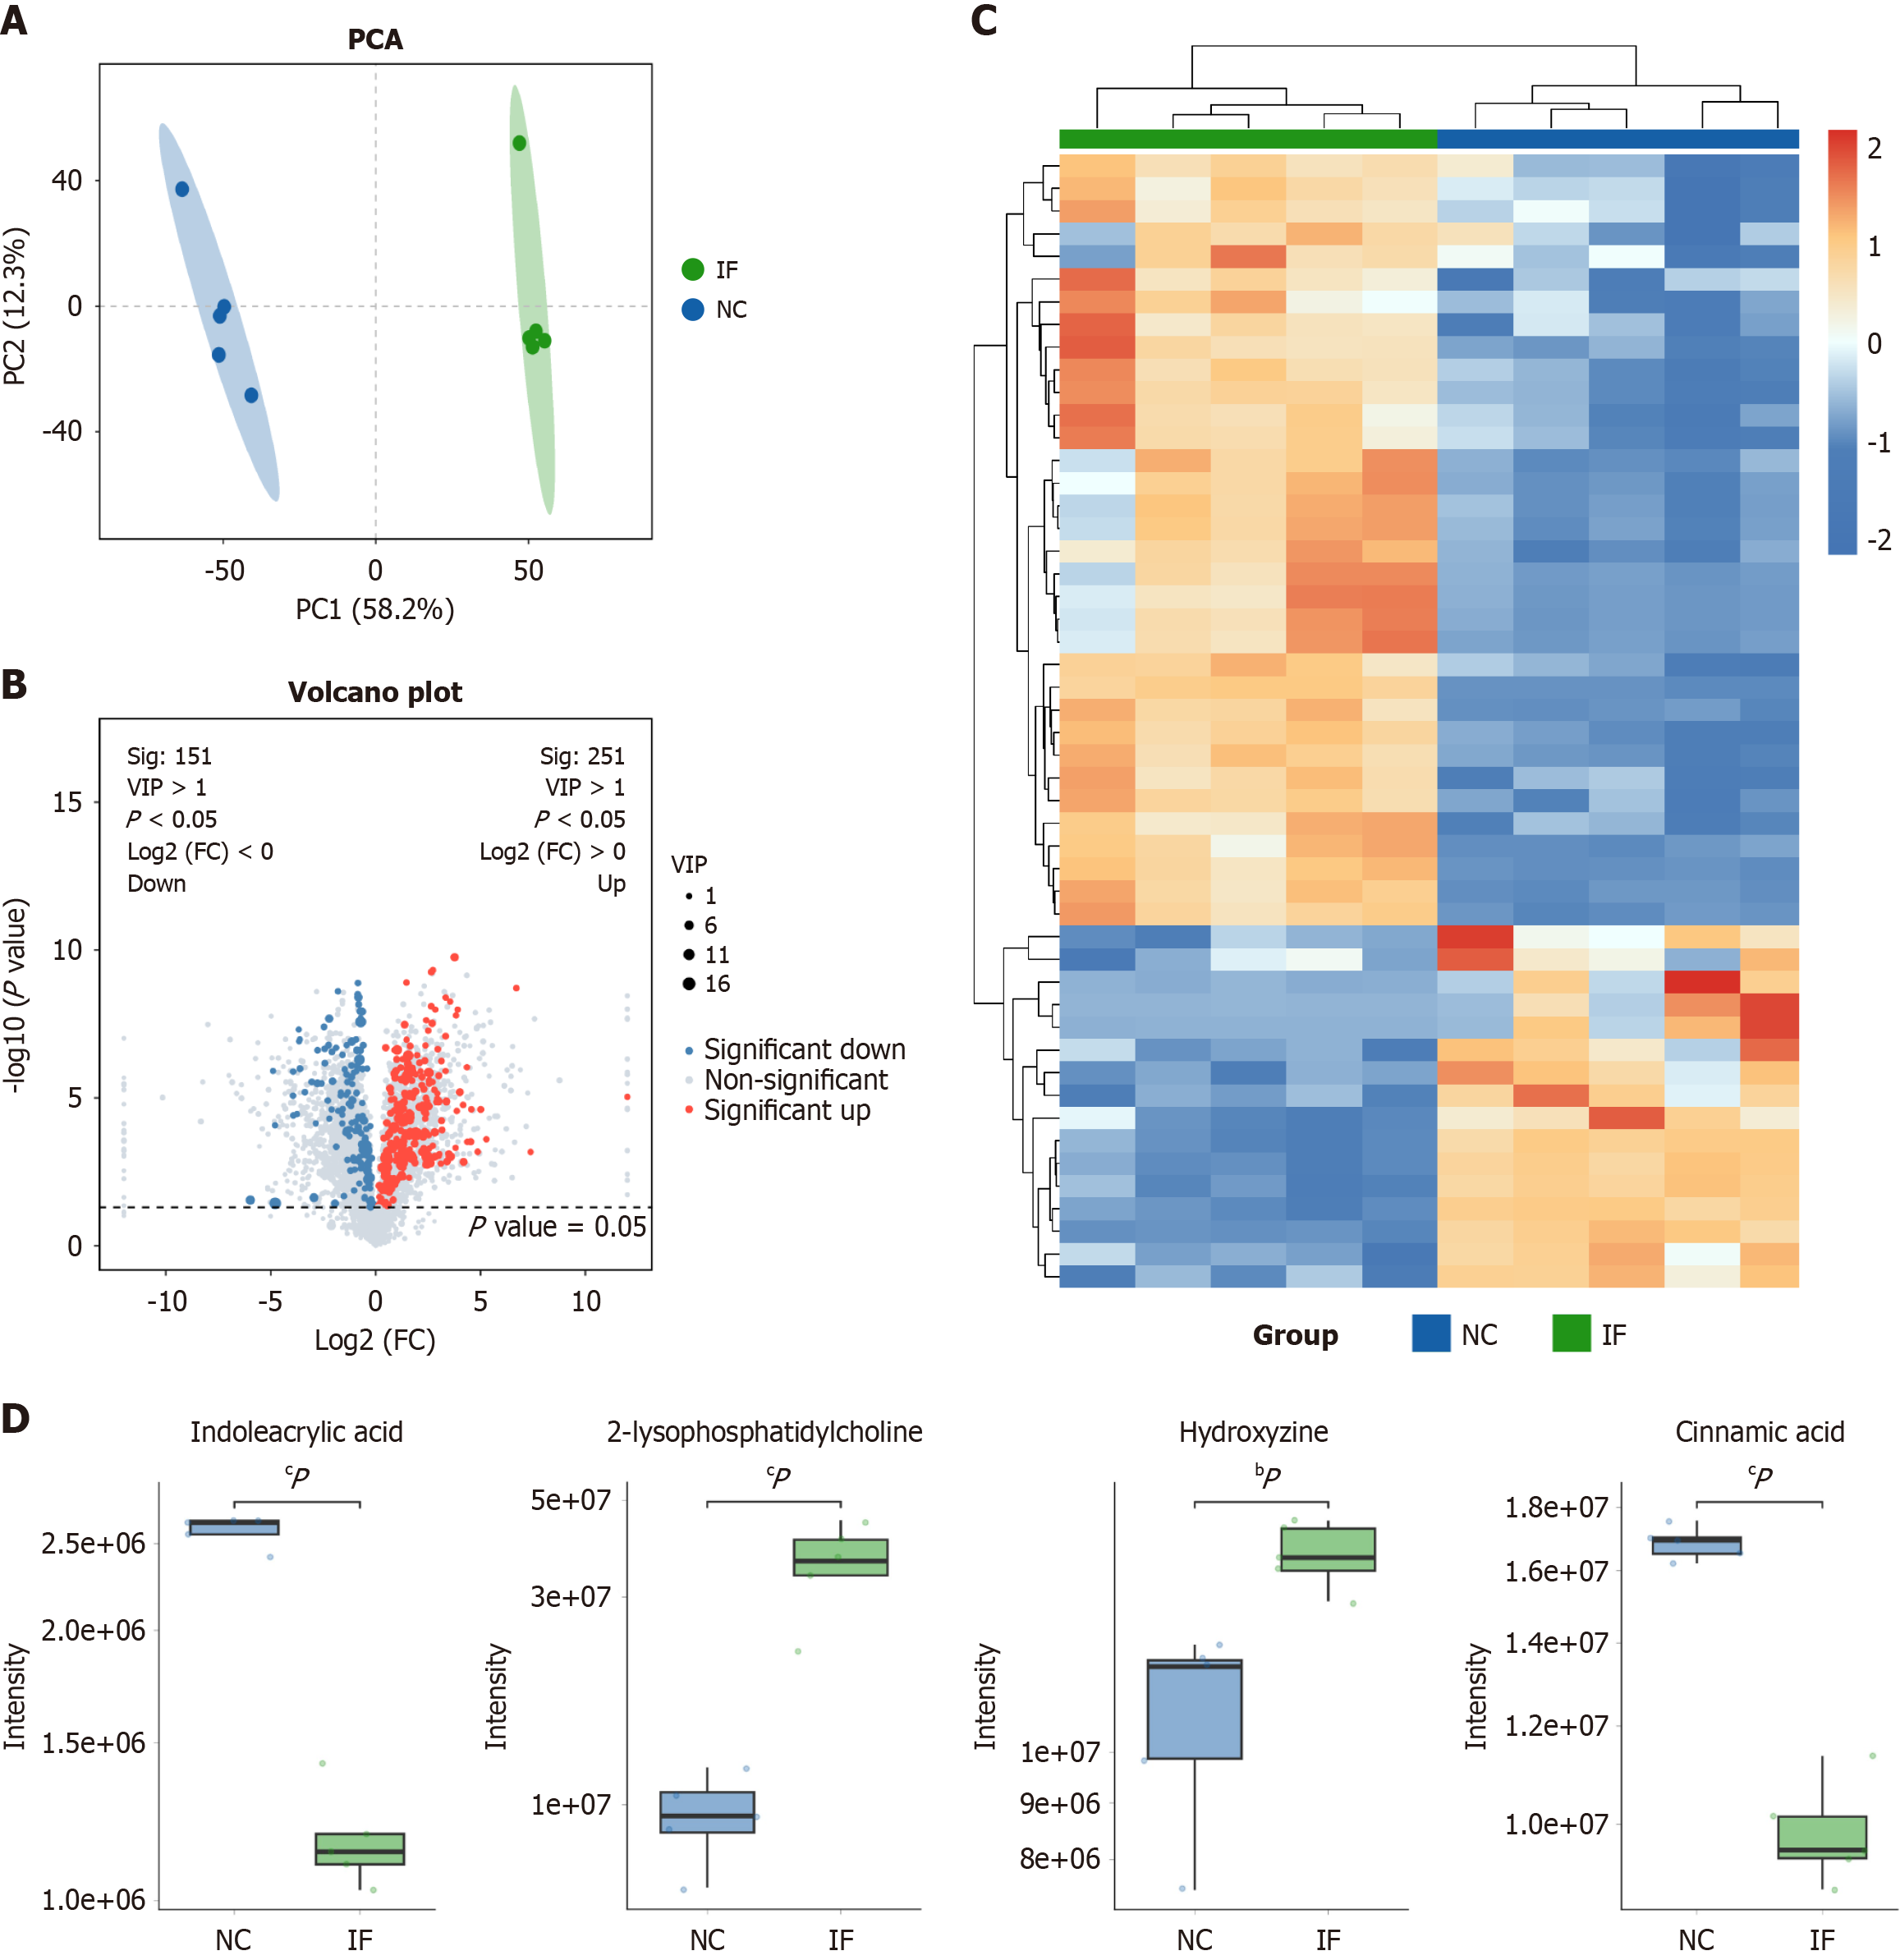
Figure 2 Untargeted metabolomics analysis.
A: Normal control (NC) (blue) and intermittent fasting (IF) (green) were significantly separated on the principal component analysis plot; B: 251 metabolites with significant differences between the two groups, with 151 downregulated; C: Hierarchical clustering of expression of all significantly differential metabolites as well as significantly differential metabolites in variable importance in the projection top 50, The heat map indicates significant differences in metabolite expression between the two groups; D: By using the boxplot, we visually found the distribution of indoleacrylic acid, 2-lysopho
- Citation: Fu R, Zhang P, Zhang JW, Hong Y, Chen B, Cao GD. Intermittent fasting exacerbates colon inflammation by promoting Th17 cell differentiation through inhibition of gut microbiota-derived indoleacrylic acid. World J Gastroenterol 2025; 31(22): 108815
- URL: https://www.wjgnet.com/1007-9327/full/v31/i22/108815.htm
- DOI: https://dx.doi.org/10.3748/wjg.v31.i22.108815


