Copyright
©The Author(s) 2025.
World J Gastroenterol. Jun 14, 2025; 31(22): 105201
Published online Jun 14, 2025. doi: 10.3748/wjg.v31.i22.105201
Published online Jun 14, 2025. doi: 10.3748/wjg.v31.i22.105201
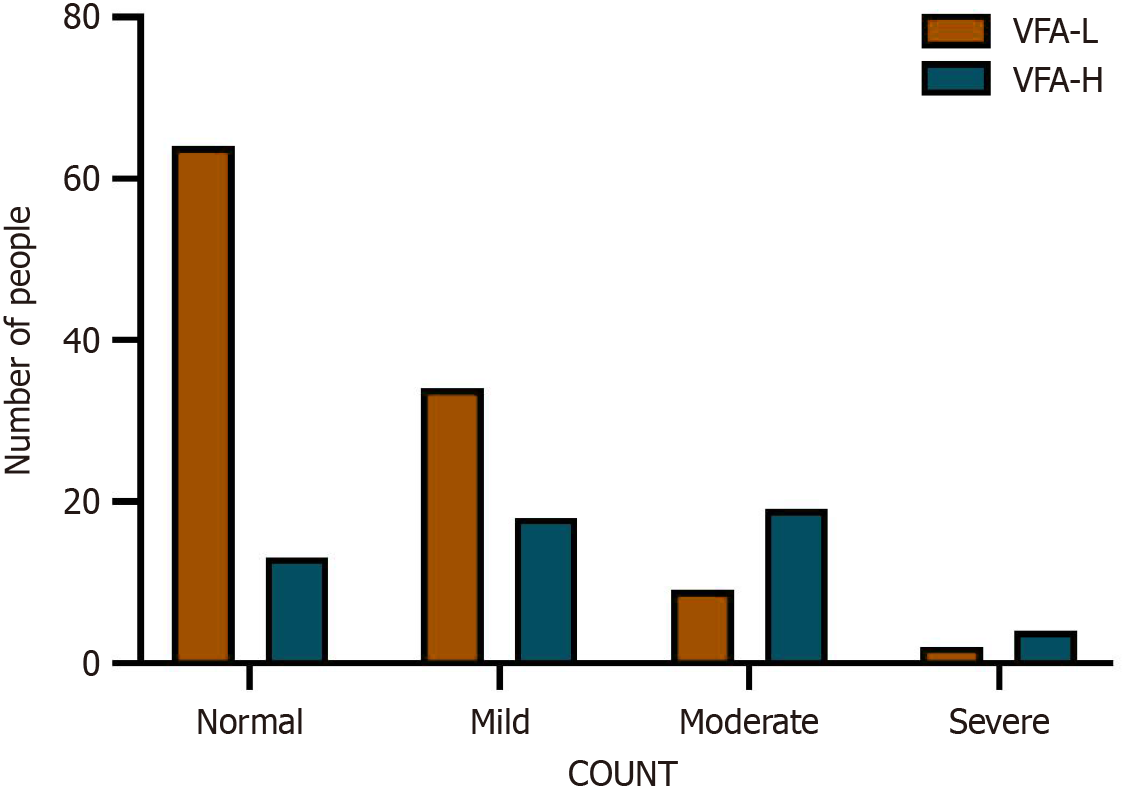
Figure 2 Comparison of controlling nutritional status between the two groups.
This column depicts the distribution of the number of patients in each of the four categories of the controlling nutritional status score for the two groups: Low visceral fat area and high visceral fat area. COUNT: Controlling nutritional status; VFA-L: Low visceral fat area; VFA-H: High visceral fat area.
- Citation: Li WF, Que CR, Xu DB, Li P. Impact of visceral fat distribution on postoperative complications in high-aged patients undergoing gastric cancer surgery: A cross-sectional study. World J Gastroenterol 2025; 31(22): 105201
- URL: https://www.wjgnet.com/1007-9327/full/v31/i22/105201.htm
- DOI: https://dx.doi.org/10.3748/wjg.v31.i22.105201


