Copyright
©The Author(s) 2025.
World J Gastroenterol. Jun 7, 2025; 31(21): 106939
Published online Jun 7, 2025. doi: 10.3748/wjg.v31.i21.106939
Published online Jun 7, 2025. doi: 10.3748/wjg.v31.i21.106939
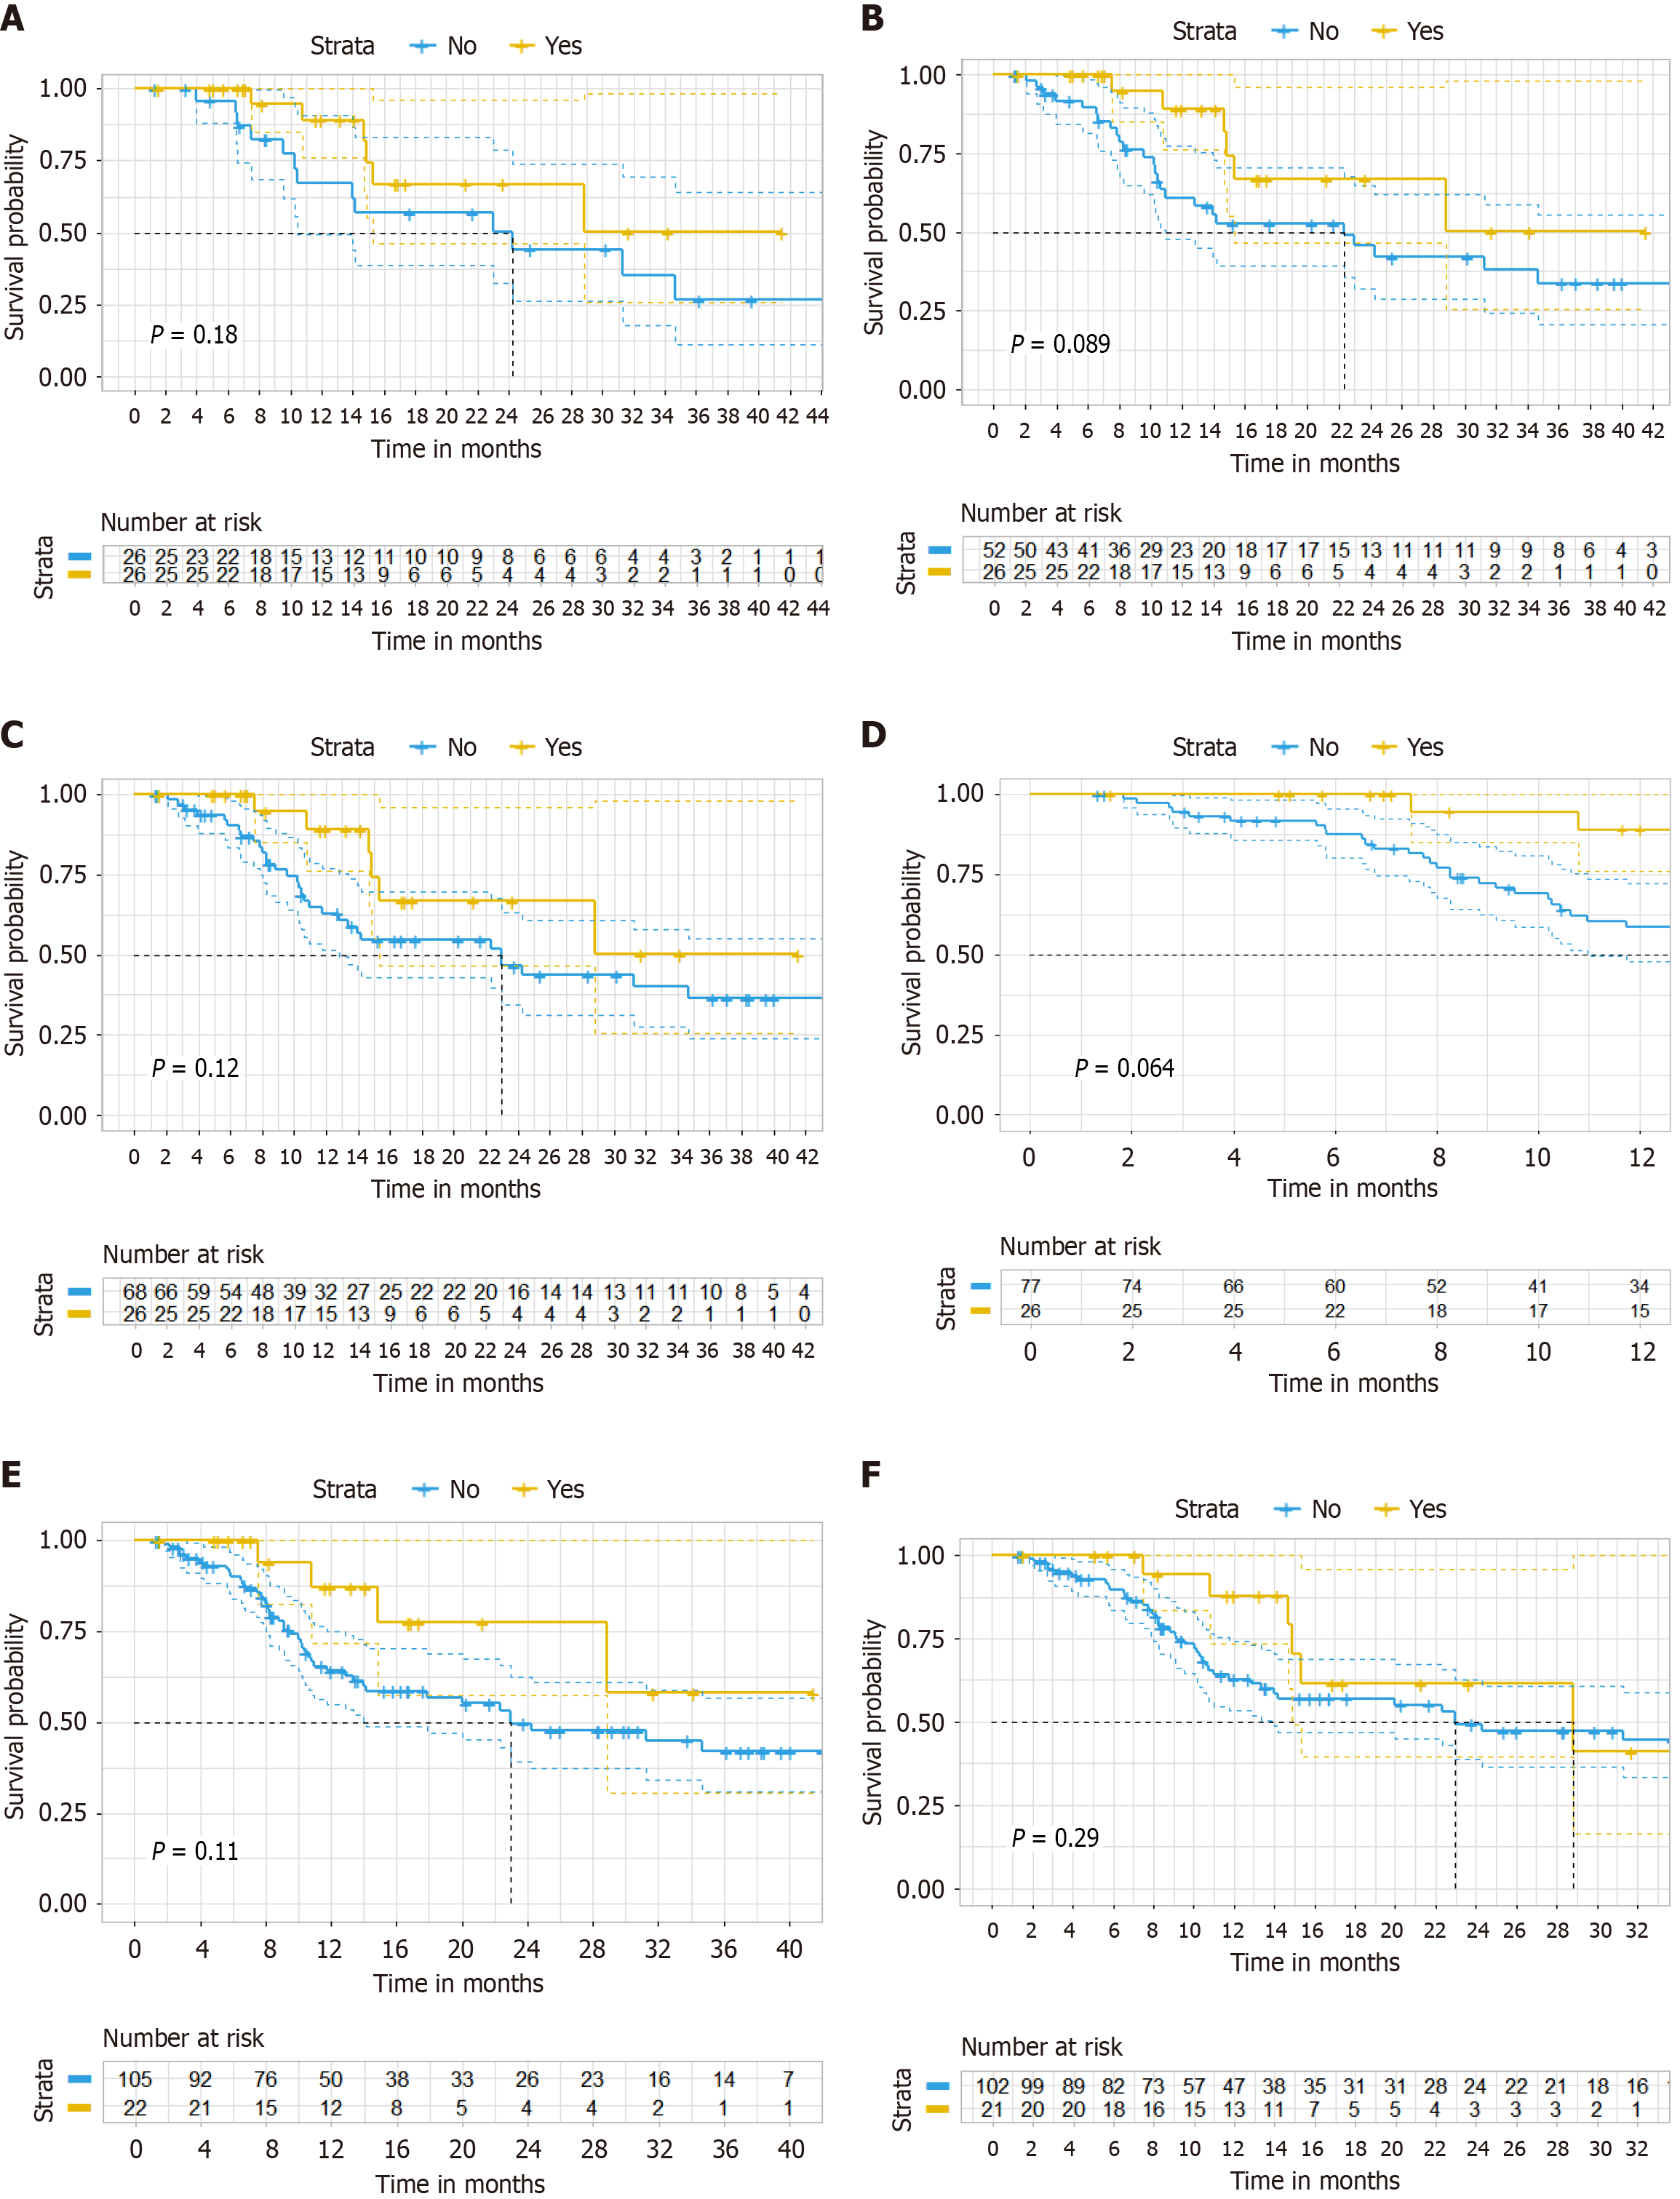
Figure 5 Sensitivity analysis of overall survival.
A: After propensity score-matching analysis in overall survival (OS) (ratio = 1); B: After propensity score-matching analysis in OS (ratio = 2); C: After propensity score-matching analysis in OS (ratio = 3); D: After inverse probability of treatment weighting analysis (OS); E: Kaplan-Meier curve after excluding 4 patients who received single-agent chemotherapy combined with bevacizumab and anti-programmed death 1 immunotherapy in OS; F: Kaplan-Meier curve restricting the cohort to irinotecan-based chemotherapy patients in OS.
- Citation: Gao Z, Wang XY, Shen ZG, Liu JH, Wang XY, Wu SK, Jin X. Chemotherapy plus bevacizumab with or without anti-programmed death 1 immunotherapy as the second-line therapy in colorectal cancer. World J Gastroenterol 2025; 31(21): 106939
- URL: https://www.wjgnet.com/1007-9327/full/v31/i21/106939.htm
- DOI: https://dx.doi.org/10.3748/wjg.v31.i21.106939


