Copyright
©The Author(s) 2025.
World J Gastroenterol. Jun 7, 2025; 31(21): 105753
Published online Jun 7, 2025. doi: 10.3748/wjg.v31.i21.105753
Published online Jun 7, 2025. doi: 10.3748/wjg.v31.i21.105753
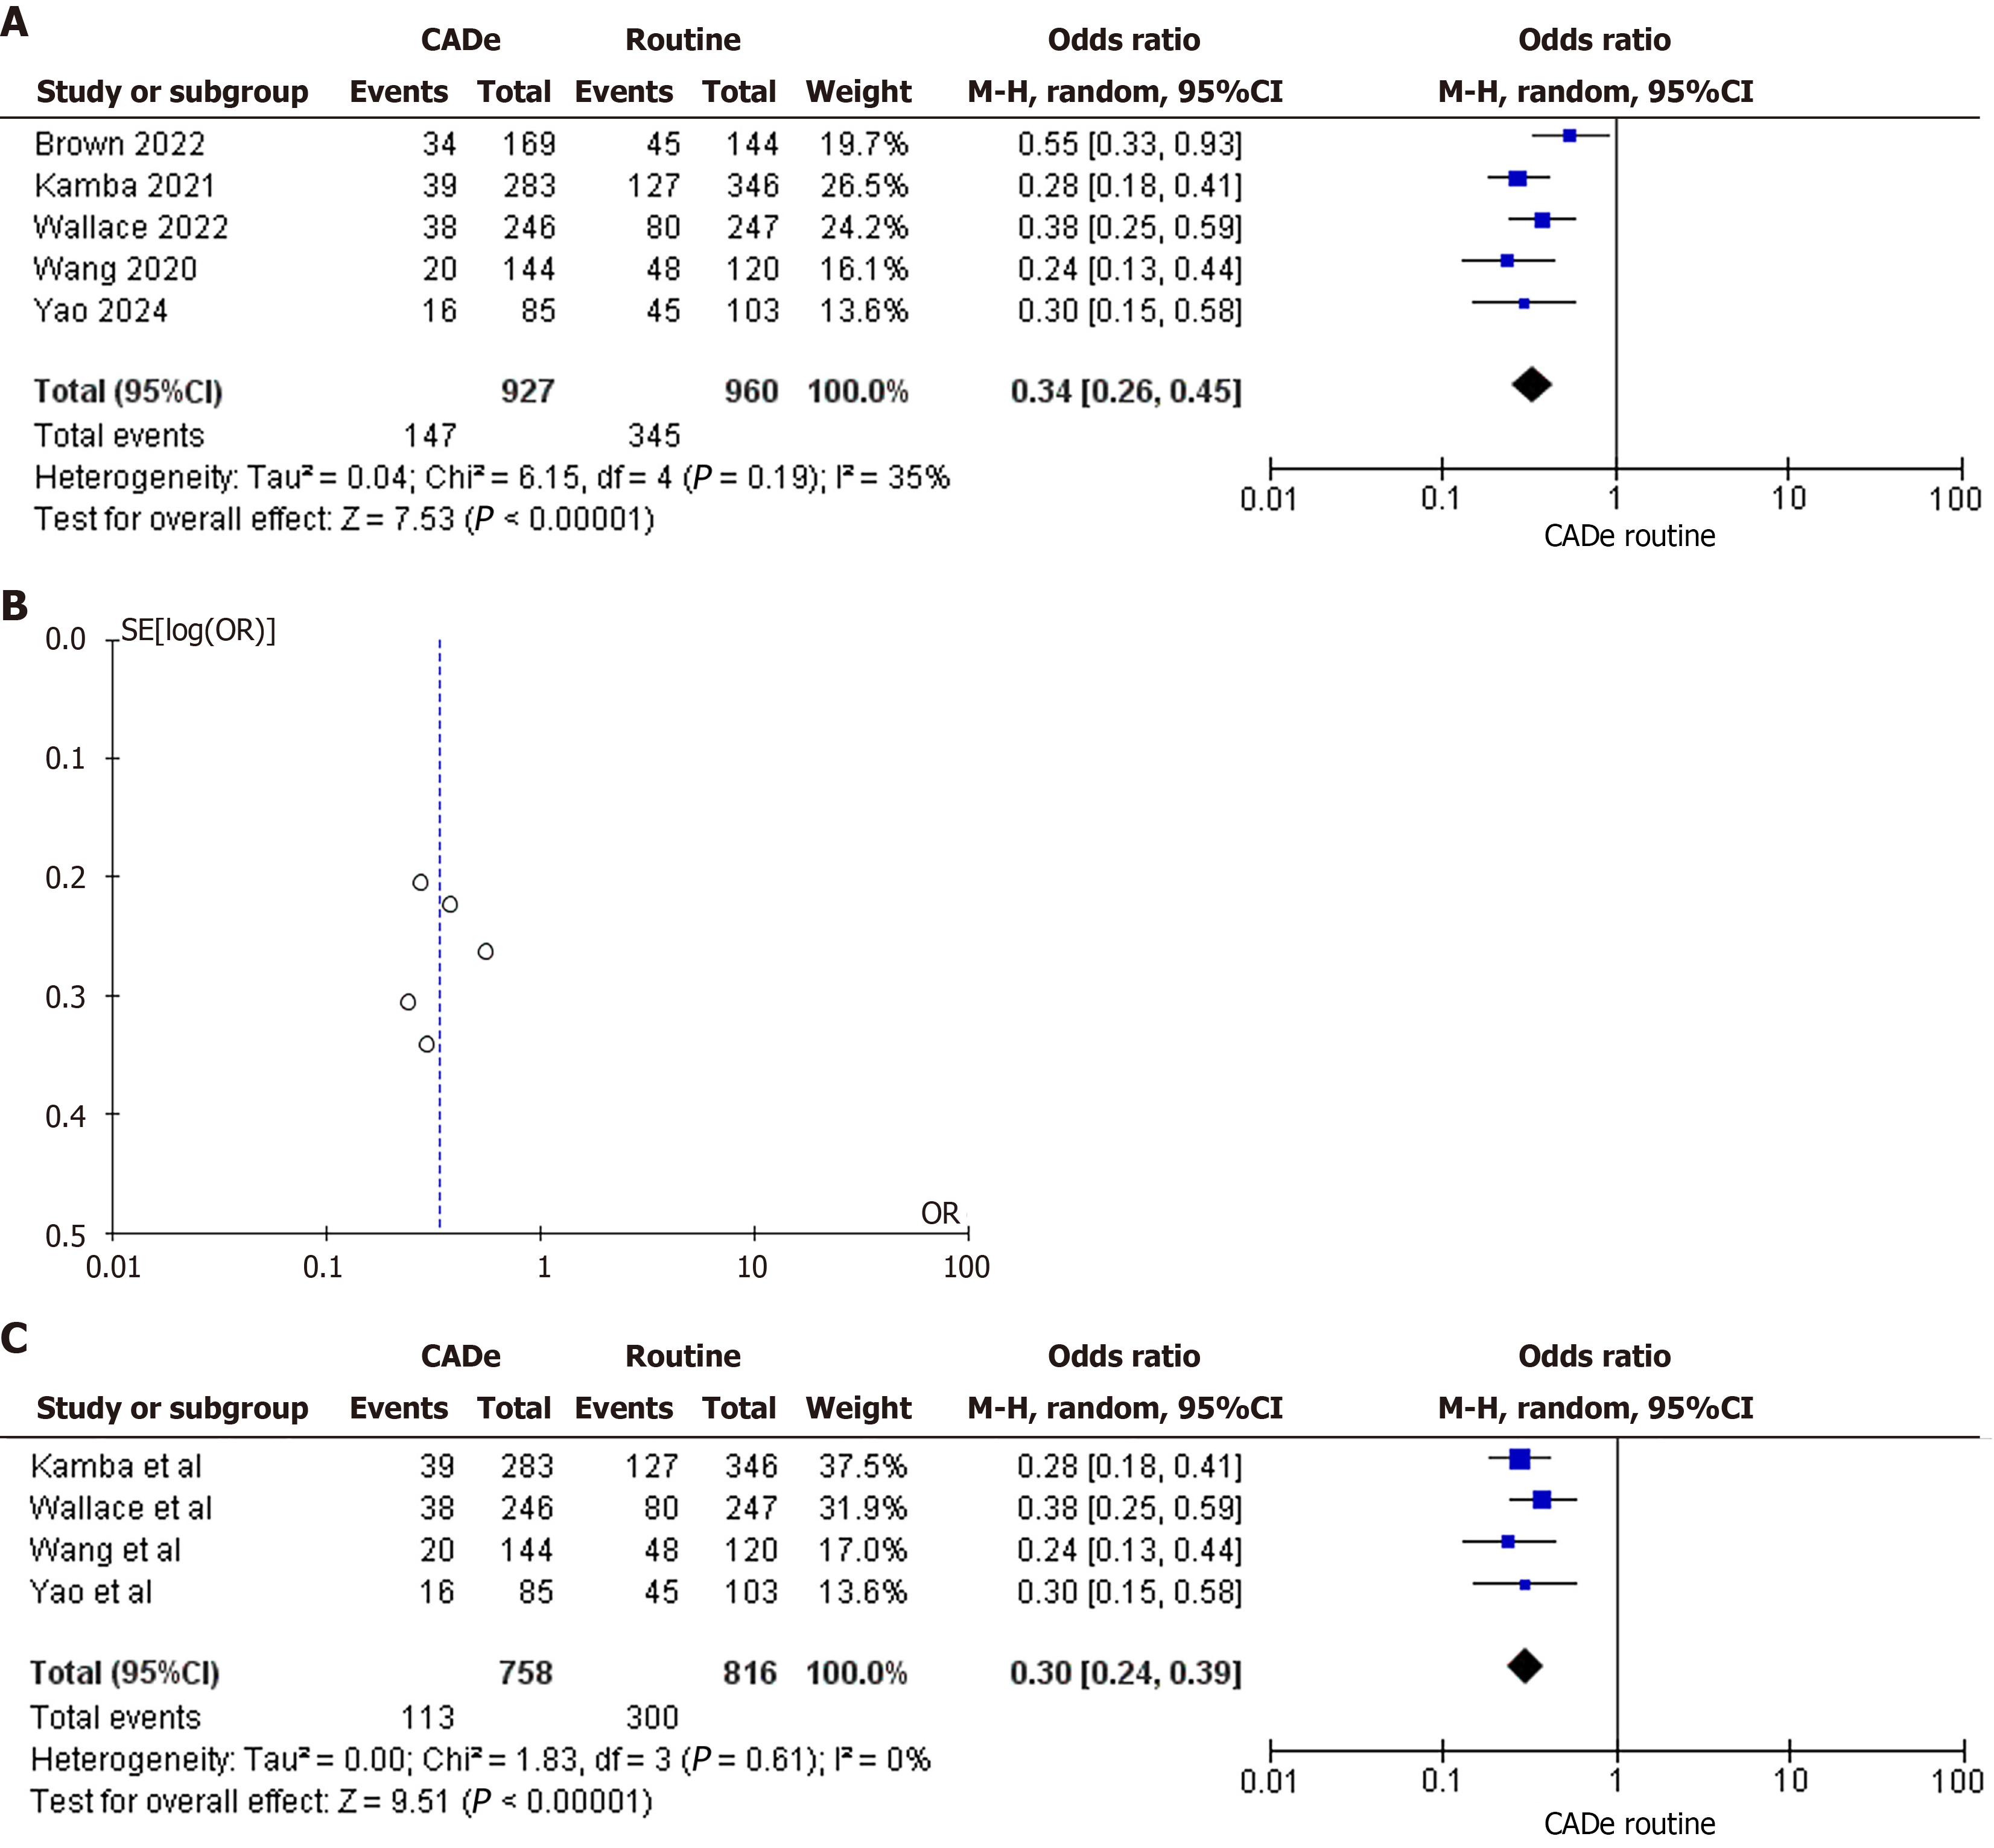
Figure 3 Forrest plots and funnel plot.
A: Forrest plot showing adenoma miss rate for colonoscopy with vs without computer-aided detection (CADe) assistance for the included studies; B: Funnel plot showing associated publication bias; C: Sensitivity analysis of adenoma miss rate for colonoscopy with vs without CADe assistance for the included studies. CADe: Computer-aided detection; OR: Odds ratio.
- Citation: Wang SY, Gao JC, Wu SD. Artificial intelligence for reducing missed detection of adenomas and polyps in colonoscopy: A systematic review and meta-analysis. World J Gastroenterol 2025; 31(21): 105753
- URL: https://www.wjgnet.com/1007-9327/full/v31/i21/105753.htm
- DOI: https://dx.doi.org/10.3748/wjg.v31.i21.105753


