Copyright
©The Author(s) 2025.
World J Gastroenterol. May 28, 2025; 31(20): 104891
Published online May 28, 2025. doi: 10.3748/wjg.v31.i20.104891
Published online May 28, 2025. doi: 10.3748/wjg.v31.i20.104891
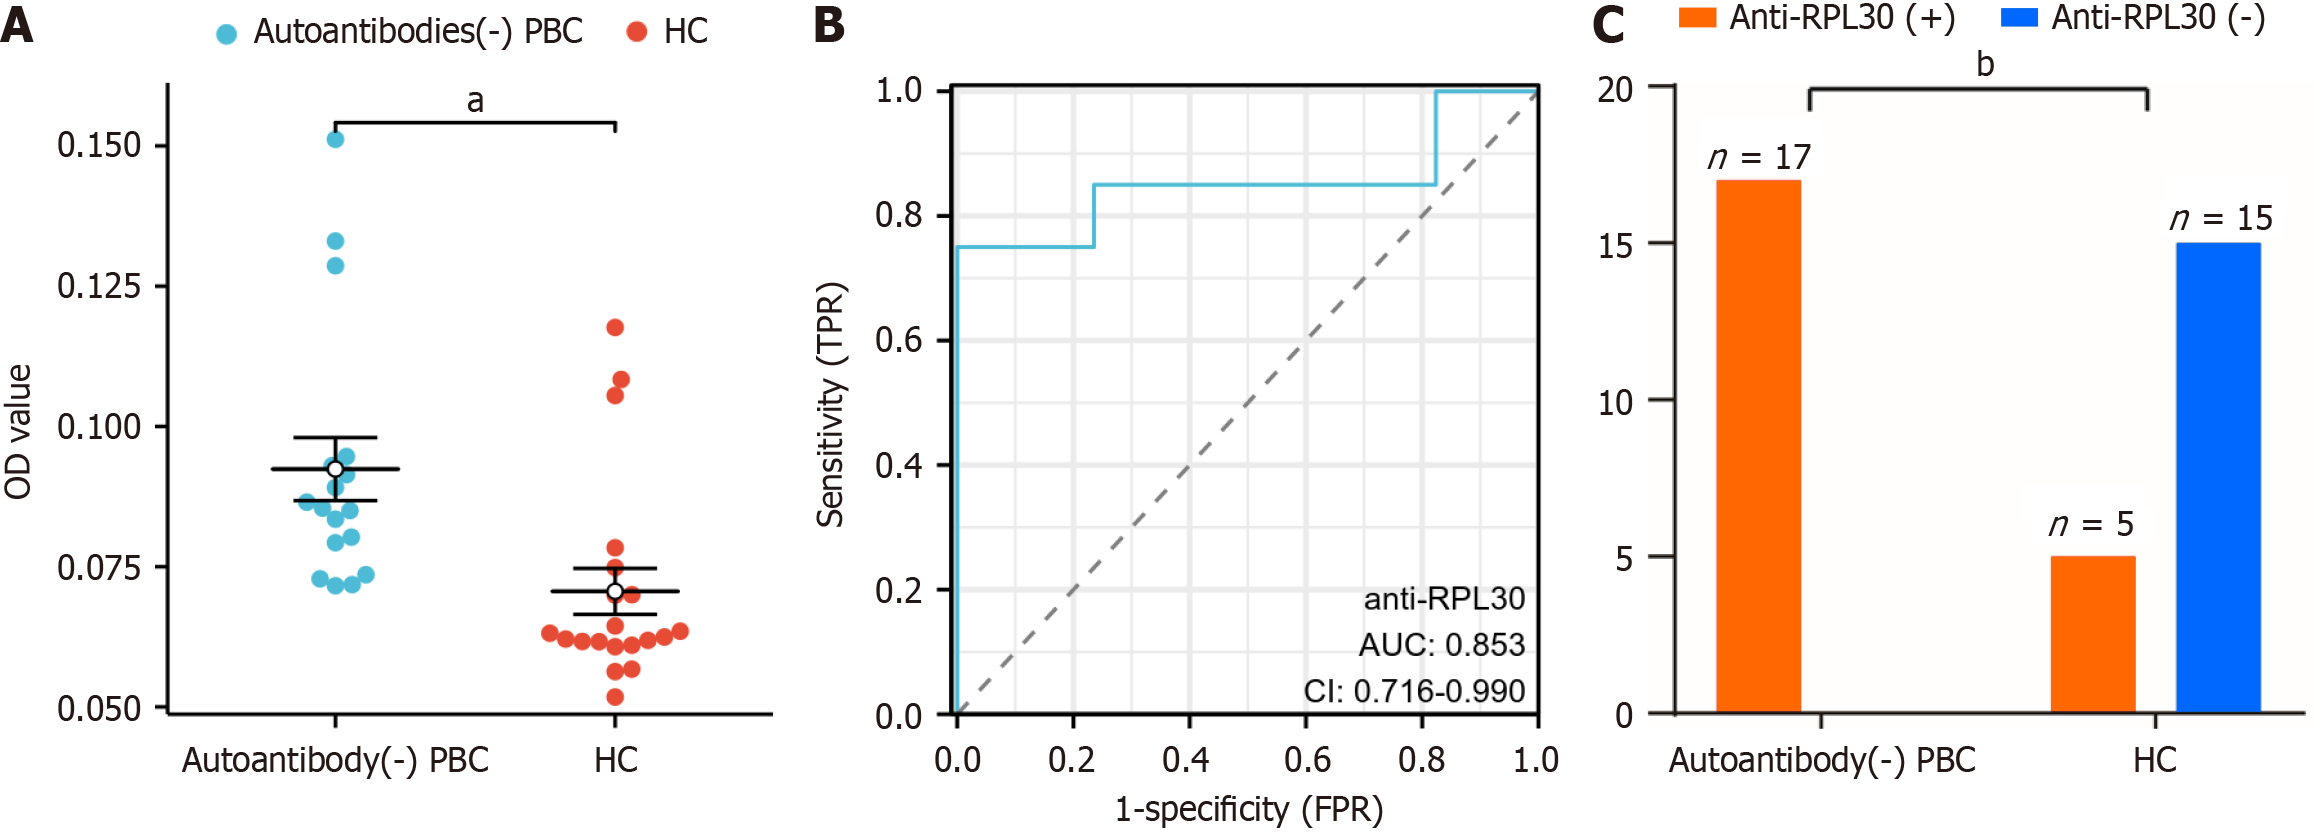
Figure 3 ELISA of the autoantibody RPL30 in autoantibody-negative primary biliary cholangitis and healthy control.
A: Scatter plot diagram of the optical density value level with the RPL30 antibody in the antibody-negative primary biliary cholangitis group and health control group; B: Analysis of receiver operating characteristic with a cutoff value = 0.0708, sensitivity = 75%, and specificity = 100%; C: Histogram of RPL30 antibody-positive patients in the antibody-negative primary biliary cholangitis (anti-mitochondrial antibody, anti-mitochondrial E2 subunit antibody, anti-glycoprotein 210, anti-speckled protein 100) and the control groups. aP < 0.001, bP < 0.0001. PBC: Primary biliary cholangitis; HC: Healthy control group; OD: Optical density; AUC: Area under the receiver operating characteristic curve; TPR: True positive rate; FPR: False positive rate; CI: Confidence interval.
- Citation: Zeng ZY, Huang ZX, Wang YR, Xie LK, Lin YP, Liang Y, Liu ZY, Li DL, Zhang XY. Anti-RPL30 as a novel biomarker for enhanced diagnosis of autoantibody-negative primary biliary cholangitis. World J Gastroenterol 2025; 31(20): 104891
- URL: https://www.wjgnet.com/1007-9327/full/v31/i20/104891.htm
- DOI: https://dx.doi.org/10.3748/wjg.v31.i20.104891


