Copyright
©The Author(s) 2025.
World J Gastroenterol. Apr 14, 2025; 31(14): 99897
Published online Apr 14, 2025. doi: 10.3748/wjg.v31.i14.99897
Published online Apr 14, 2025. doi: 10.3748/wjg.v31.i14.99897
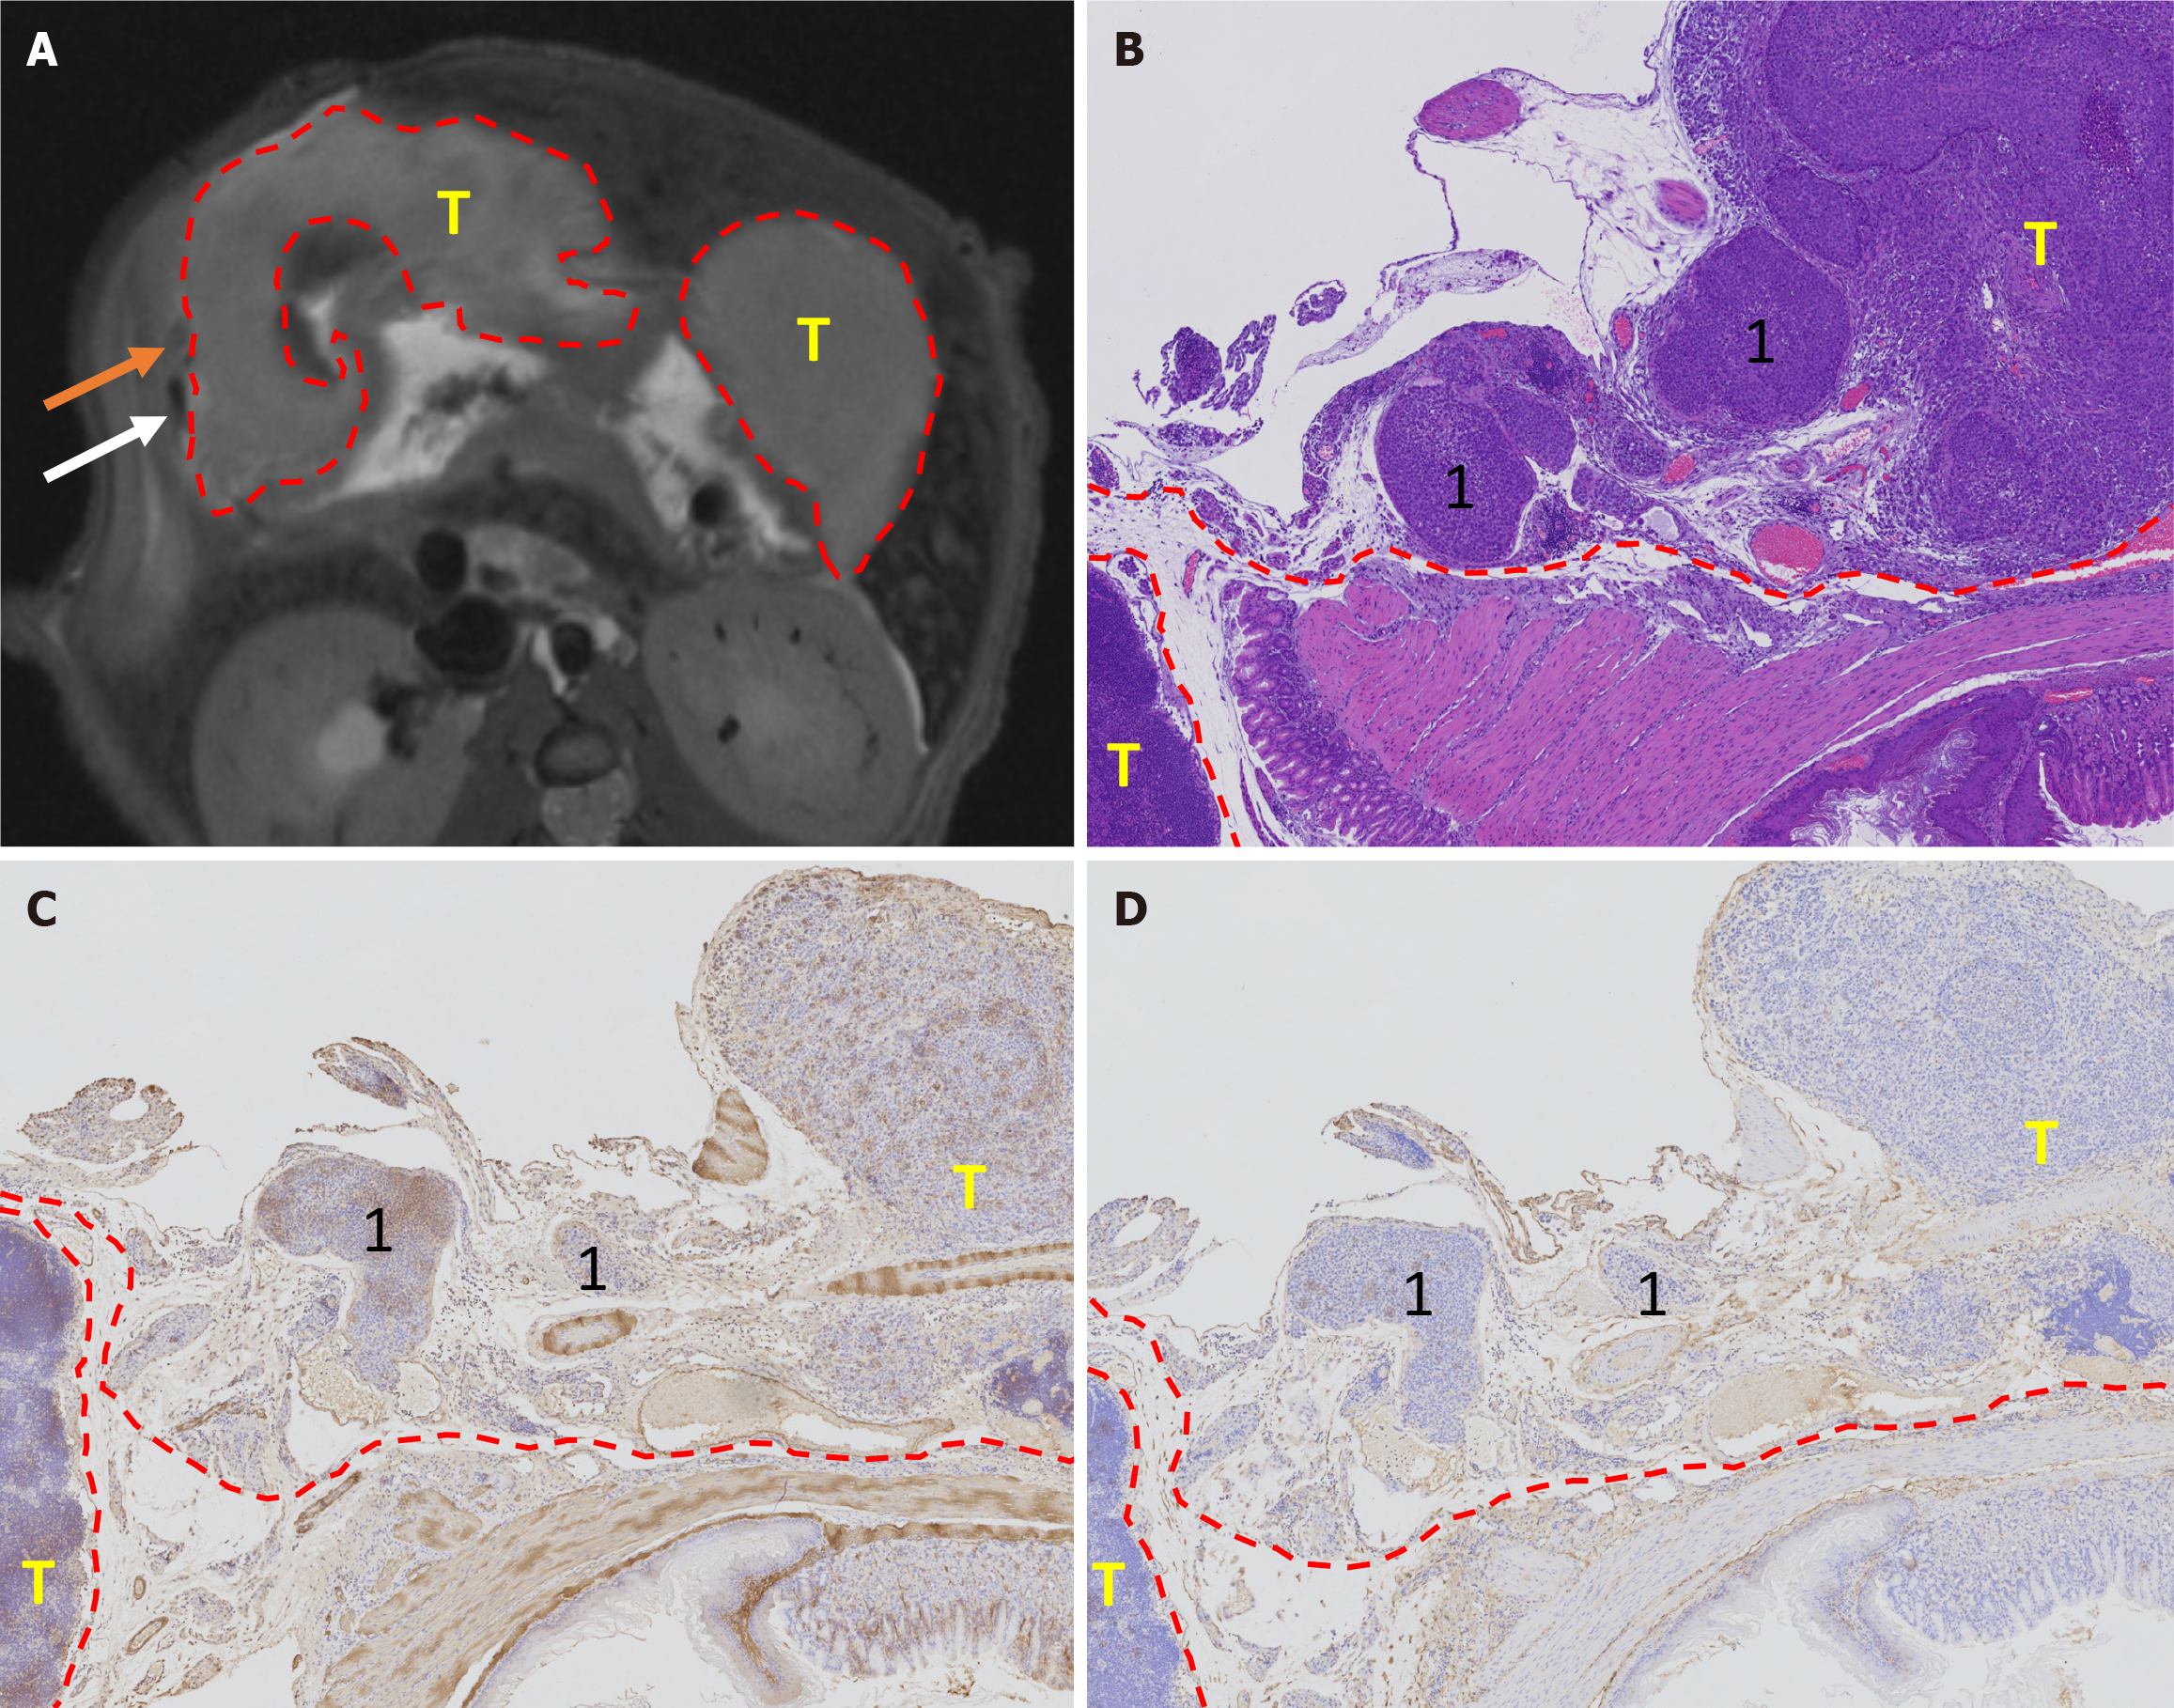
Figure 5 Extramural venous invasion in a gastric cancer orthotopic mouse model visualized parallel to the plane of magnetic resonance imaging axial imaging.
A: T2-weighted fat-suppressed images showing gastric cancer, characterized by a thickened gastric wall with homogeneous signal intensity (within the red circle). Extramural venous invasion appears as a tubular structure with slightly high signal (orange arrow), connected to the tumor and adjacent vessels (white arrow); B: Hematoxylin & eosin staining of the tumor (200 ×); C: Smooth muscle actin staining (200 ×); D: CD34 staining (200 ×). 1Extramural venous invasion; T: Tumor; red dashed line: Tumor boundary.
- Citation: Feng CZ, Gou XY, Liu YQ, Xin YW, Zhang YL, Zhao HM, Wei SC, Hong N, Wang Y, Cheng J. Extramural venous invasion in gastric cancer: 9.4T magnetic resonance imaging assessment and circular RNA functional analysis. World J Gastroenterol 2025; 31(14): 99897
- URL: https://www.wjgnet.com/1007-9327/full/v31/i14/99897.htm
- DOI: https://dx.doi.org/10.3748/wjg.v31.i14.99897


