Copyright
©The Author(s) 2025.
World J Gastroenterol. Apr 7, 2025; 31(13): 100566
Published online Apr 7, 2025. doi: 10.3748/wjg.v31.i13.100566
Published online Apr 7, 2025. doi: 10.3748/wjg.v31.i13.100566
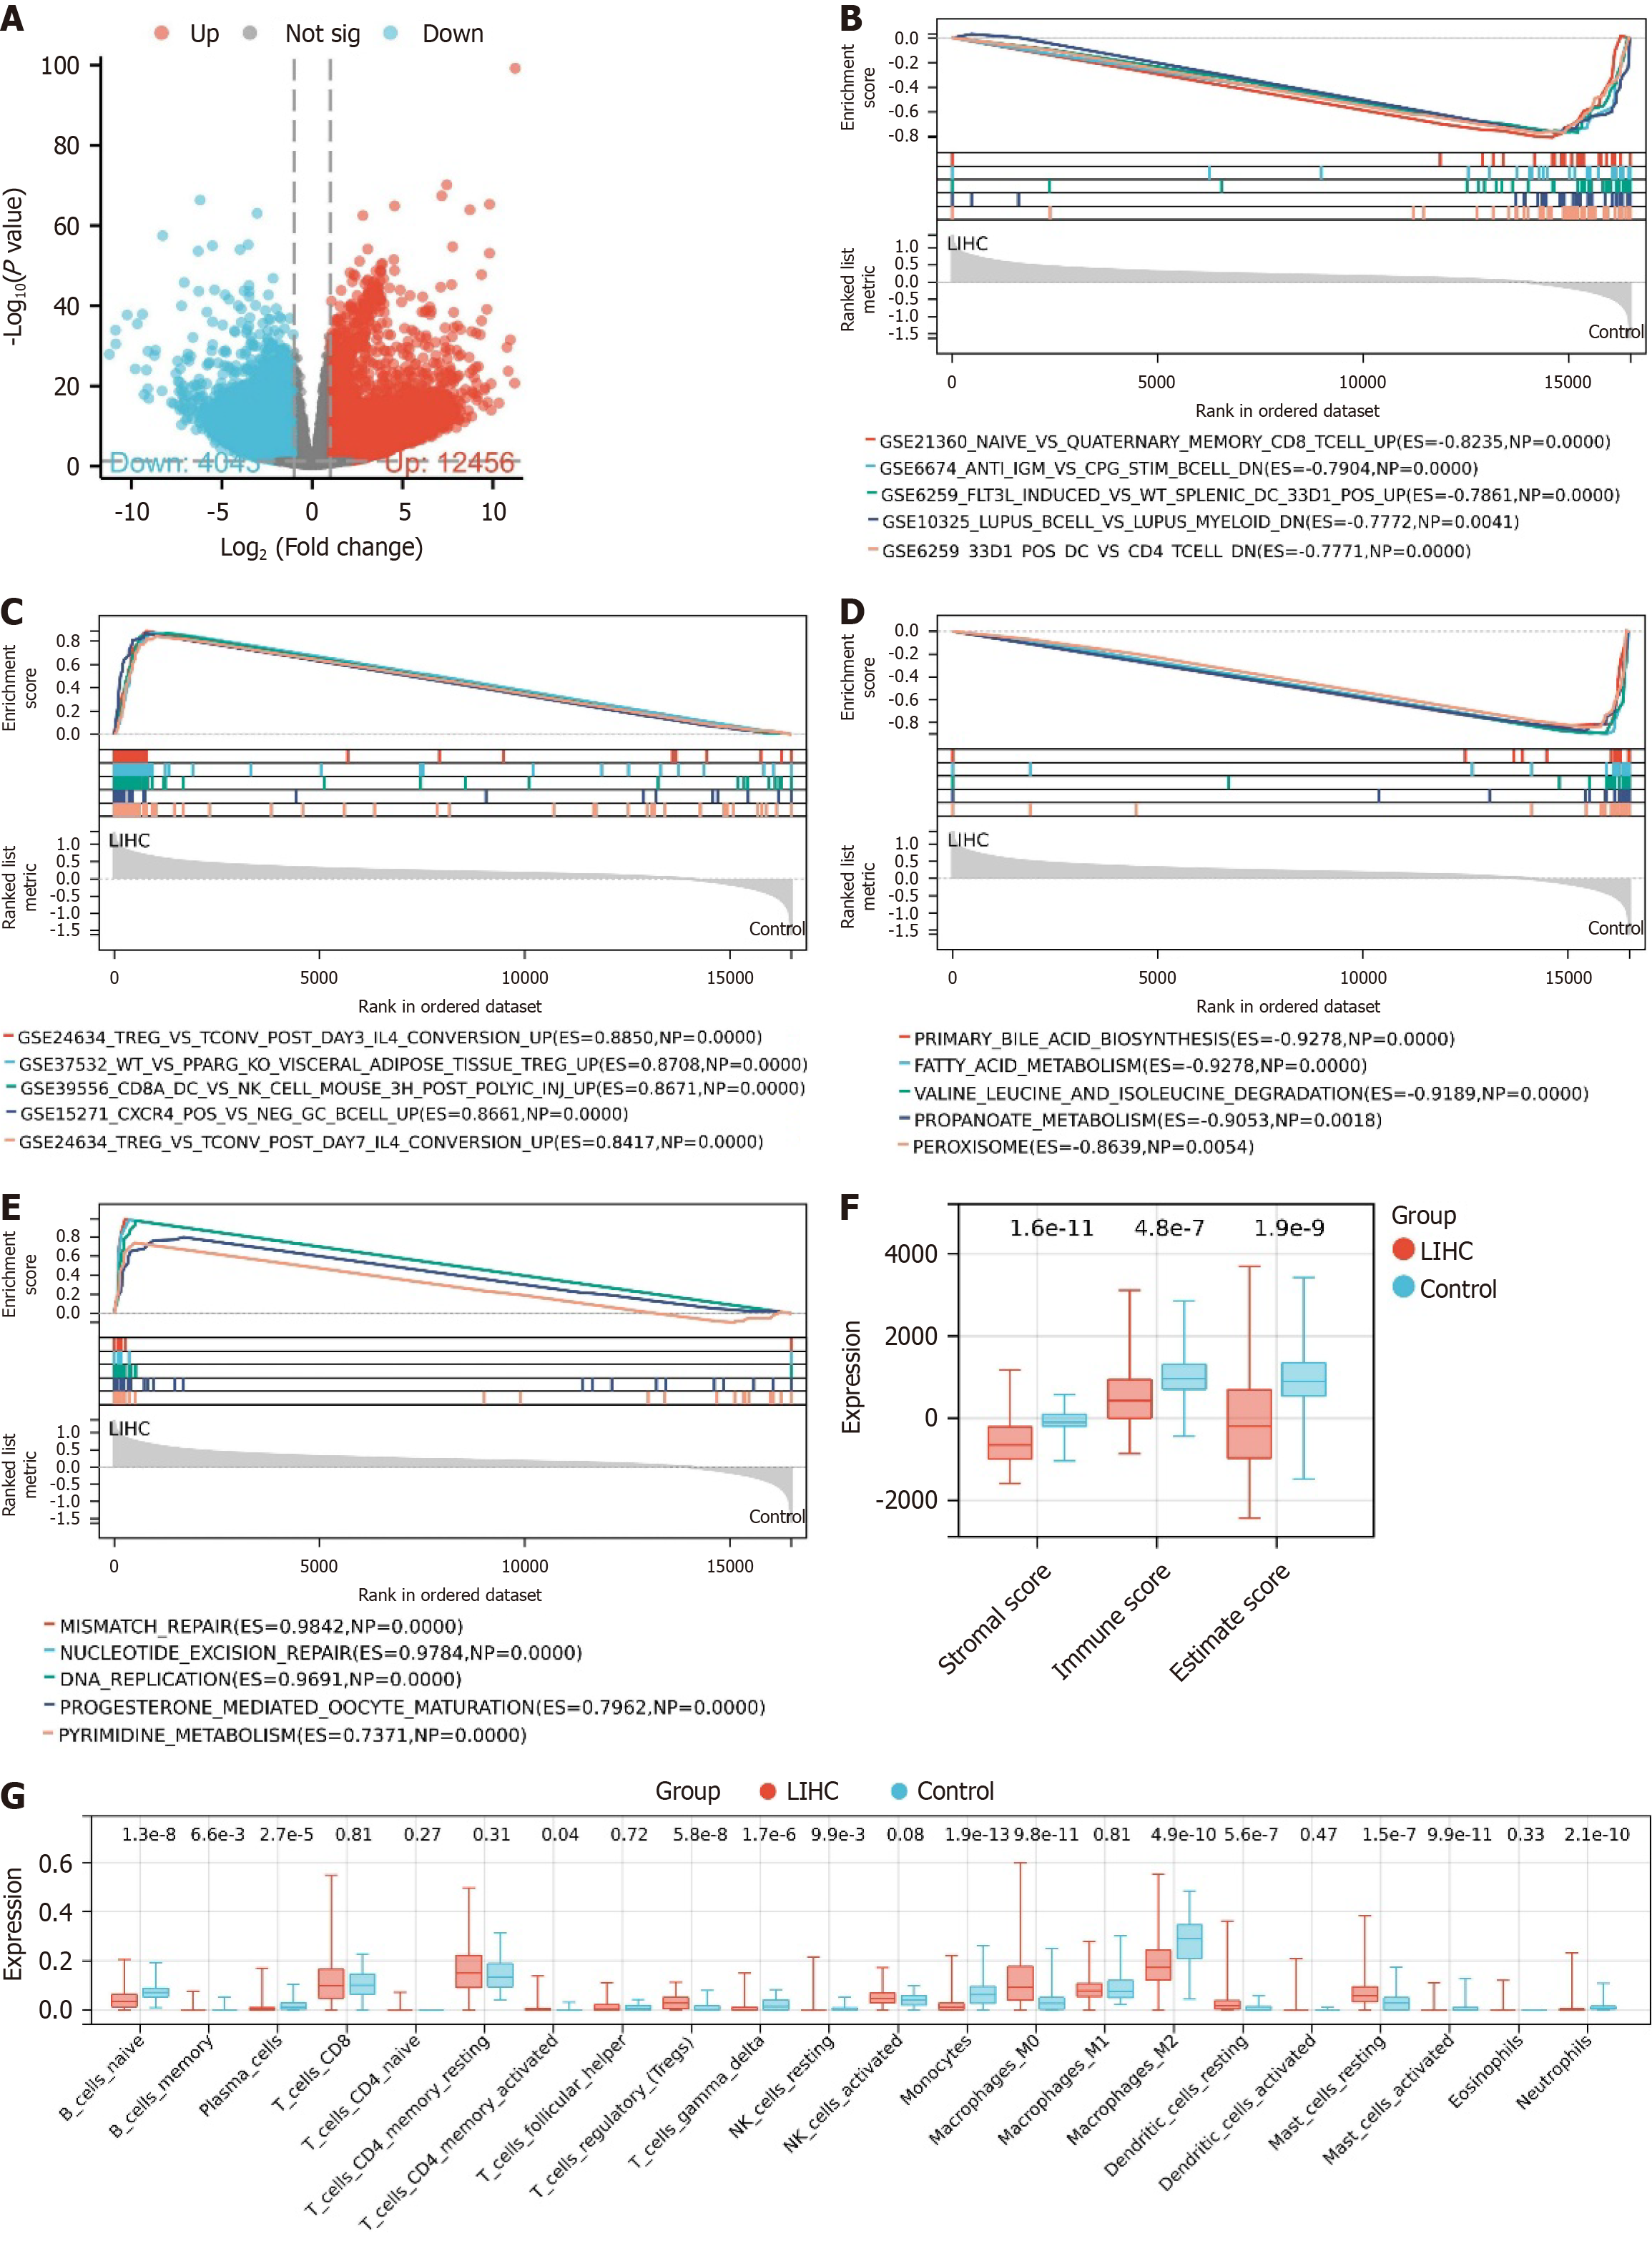
Figure 1 Gene expression and immune infiltration characteristics in liver cancer.
A: Differential analysis volcano plot of The Cancer Genome Atlas-Liver hepatocellular carcinoma (LIHC) dataset, where red represents significantly upregulated genes, blue represents significantly downregulated genes, and grey represents genes with no significant difference; B: Enrichment analysis results of immune gene sets enriched in the control group; C: Enrichment analysis results of immune gene sets enriched in the LIHC group; D: Enrichment analysis results of KEGG gene sets enriched in the control group; E: Enrichment analysis results of KEGG gene sets enriched in the LIHC group; F: Box plot of ESTIMATE immune infiltration results; G: Box plot of Cibersort immune infiltration results. Control, n = 50; LIHC, n = 373.
- Citation: Lan X, Zhang H, Chen ZY, Wang J, Zhang SC, Li Q, Ke JY, Wei W, Huang R, Tang X, Chen SP, Huang TT, Zhou YW. Suppressor of cytokine signaling 2 modulates regulatory T cell activity to suppress liver hepatocellular carcinoma growth and metastasis. World J Gastroenterol 2025; 31(13): 100566
- URL: https://www.wjgnet.com/1007-9327/full/v31/i13/100566.htm
- DOI: https://dx.doi.org/10.3748/wjg.v31.i13.100566


