Copyright
©The Author(s) 2024.
World J Gastroenterol. Mar 7, 2024; 30(9): 1164-1176
Published online Mar 7, 2024. doi: 10.3748/wjg.v30.i9.1164
Published online Mar 7, 2024. doi: 10.3748/wjg.v30.i9.1164
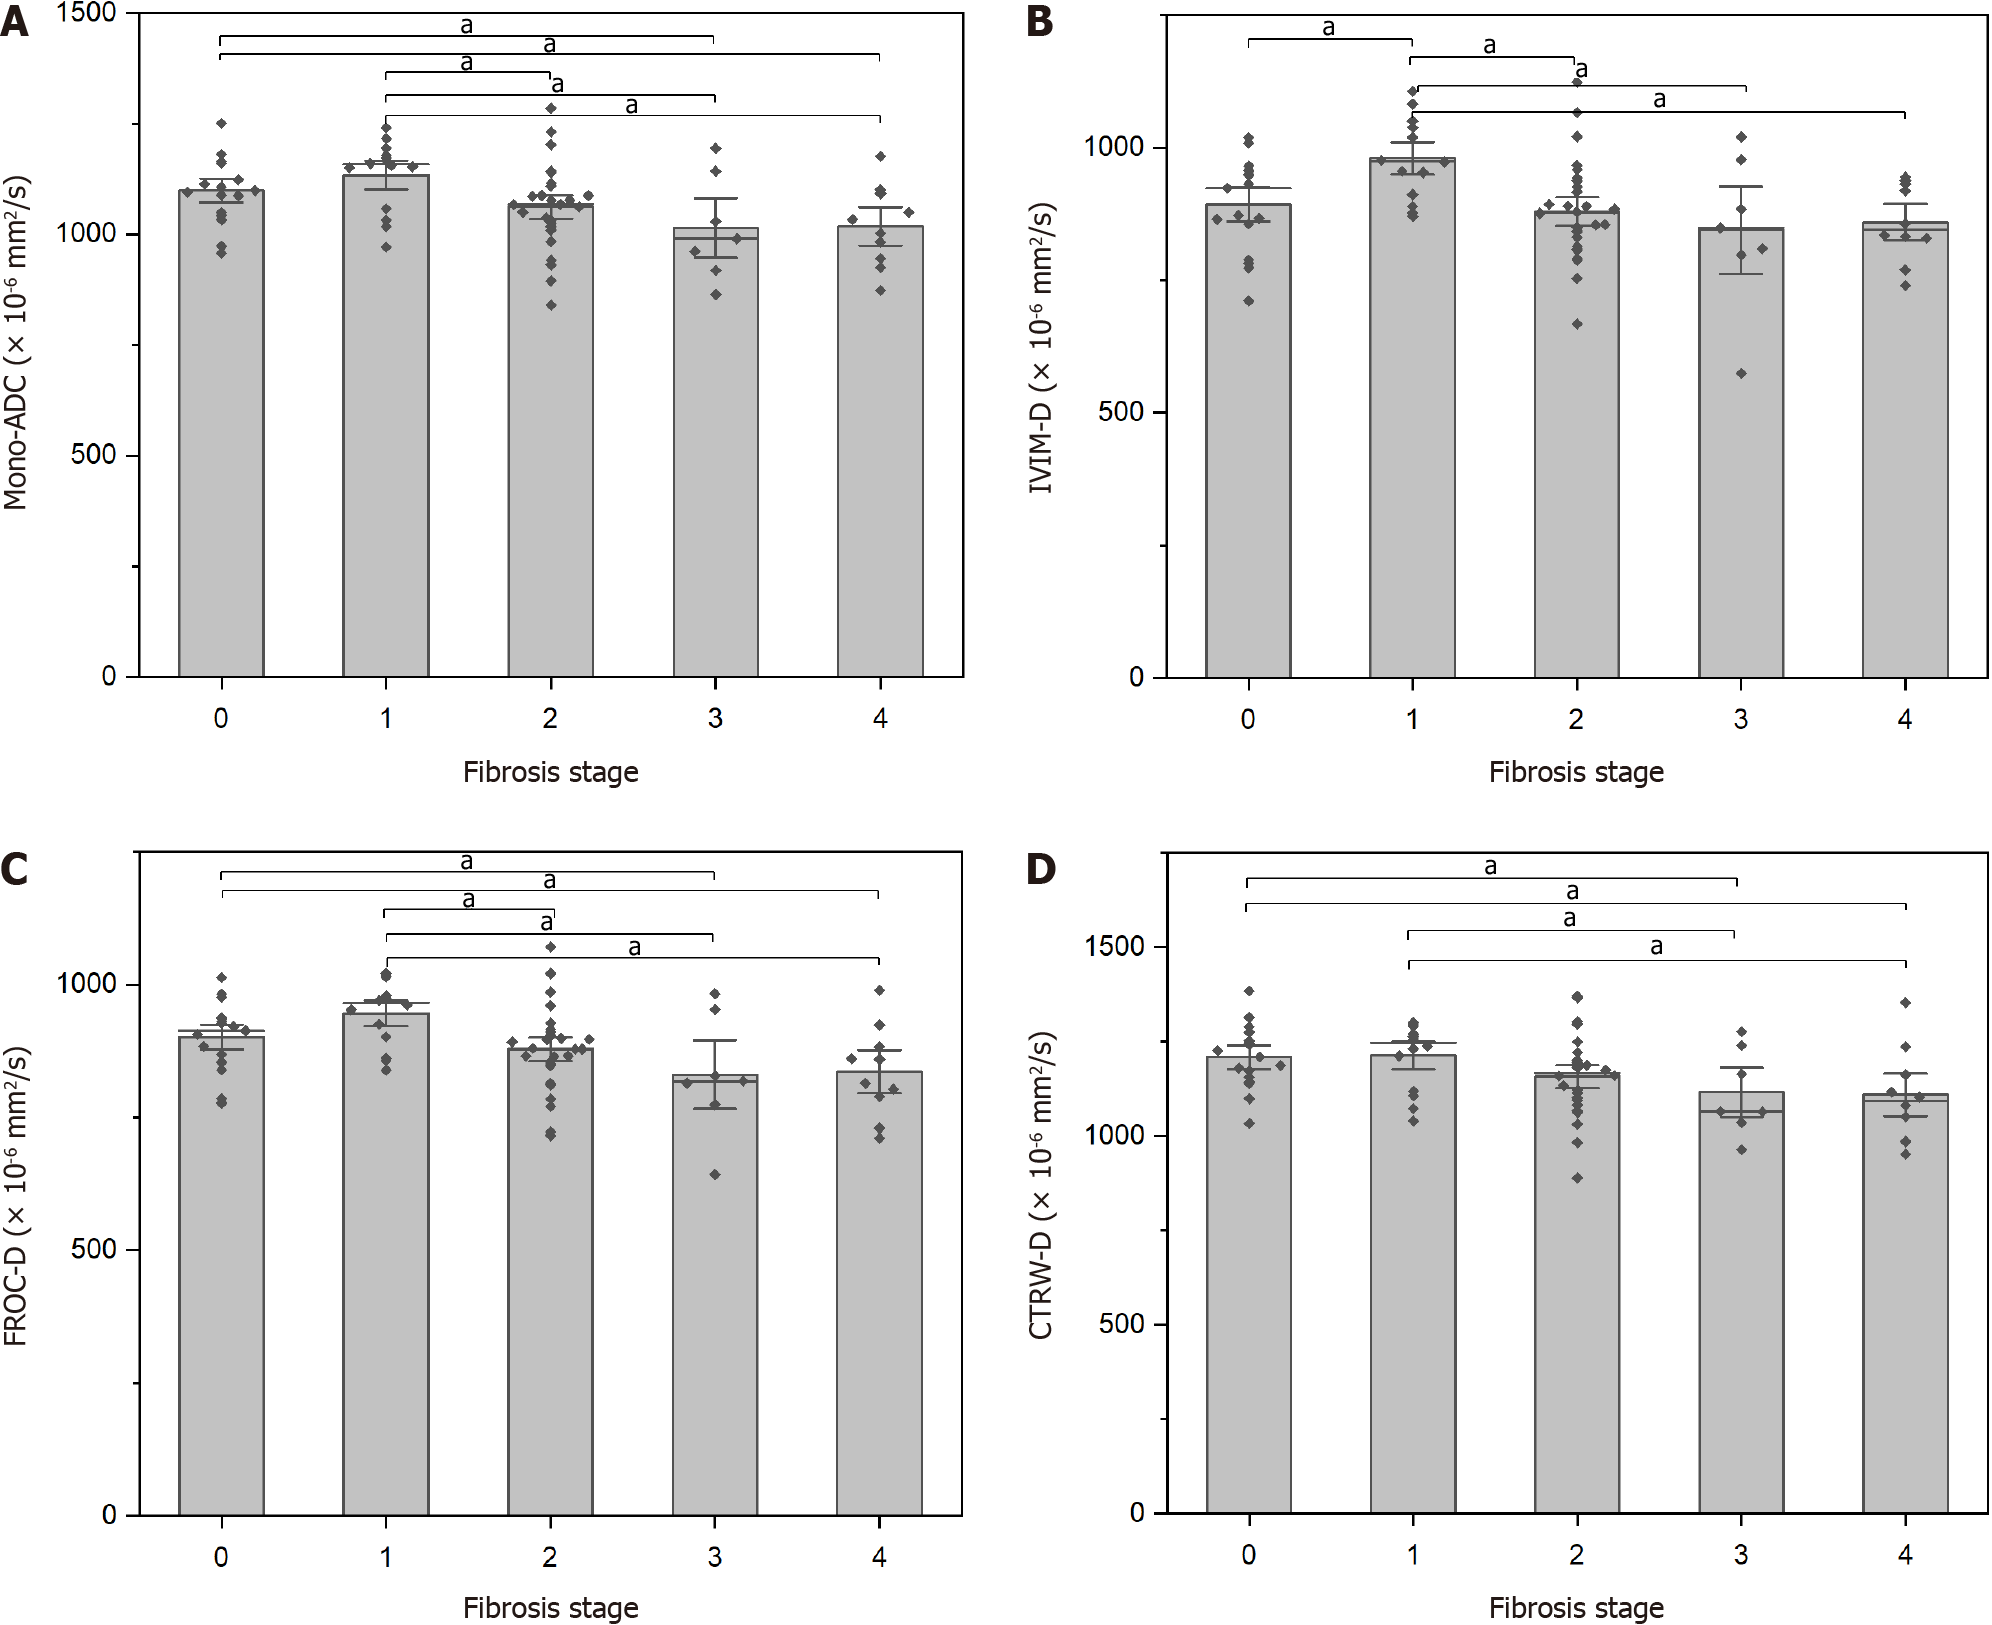
Figure 3 The detailed comparisons of Mono-apparent diffusion coefficient, intravoxel incoherent motion model-derived true diffusion coefficient, fractional order calculus model-derived diffusion coefficient and continuous-time random-walk model-derived anomalous diffusion coefficient in different stages of liver fibrosis.
A-D: Box-and-whisker plots showing the distributions of Mono-apparent diffusion coefficient (A), intravoxel incoherent motion model-derived true diffusion coefficient (B), fractional order calculus model-derived diffusion coefficient (C), and continuous-time random-walk model-derived anomalous diffusion coefficient (D) in various liver fibrosis stages (aP < 0.05). ADC: Apparent diffusion coefficient; IVIM-D: Intravoxel incoherent motion model-derived true diffusion coefficient; FROC-D: Fractional order calculus model-derived diffusion coefficient; CTRW-D: Continuous-time random-walk model-derived anomalous diffusion coefficient.
- Citation: Jiang YL, Li J, Zhang PF, Fan FX, Zou J, Yang P, Wang PF, Wang SY, Zhang J. Staging liver fibrosis with various diffusion-weighted magnetic resonance imaging models. World J Gastroenterol 2024; 30(9): 1164-1176
- URL: https://www.wjgnet.com/1007-9327/full/v30/i9/1164.htm
- DOI: https://dx.doi.org/10.3748/wjg.v30.i9.1164


