Copyright
©The Author(s) 2024.
World J Gastroenterol. Feb 28, 2024; 30(8): 969-983
Published online Feb 28, 2024. doi: 10.3748/wjg.v30.i8.969
Published online Feb 28, 2024. doi: 10.3748/wjg.v30.i8.969
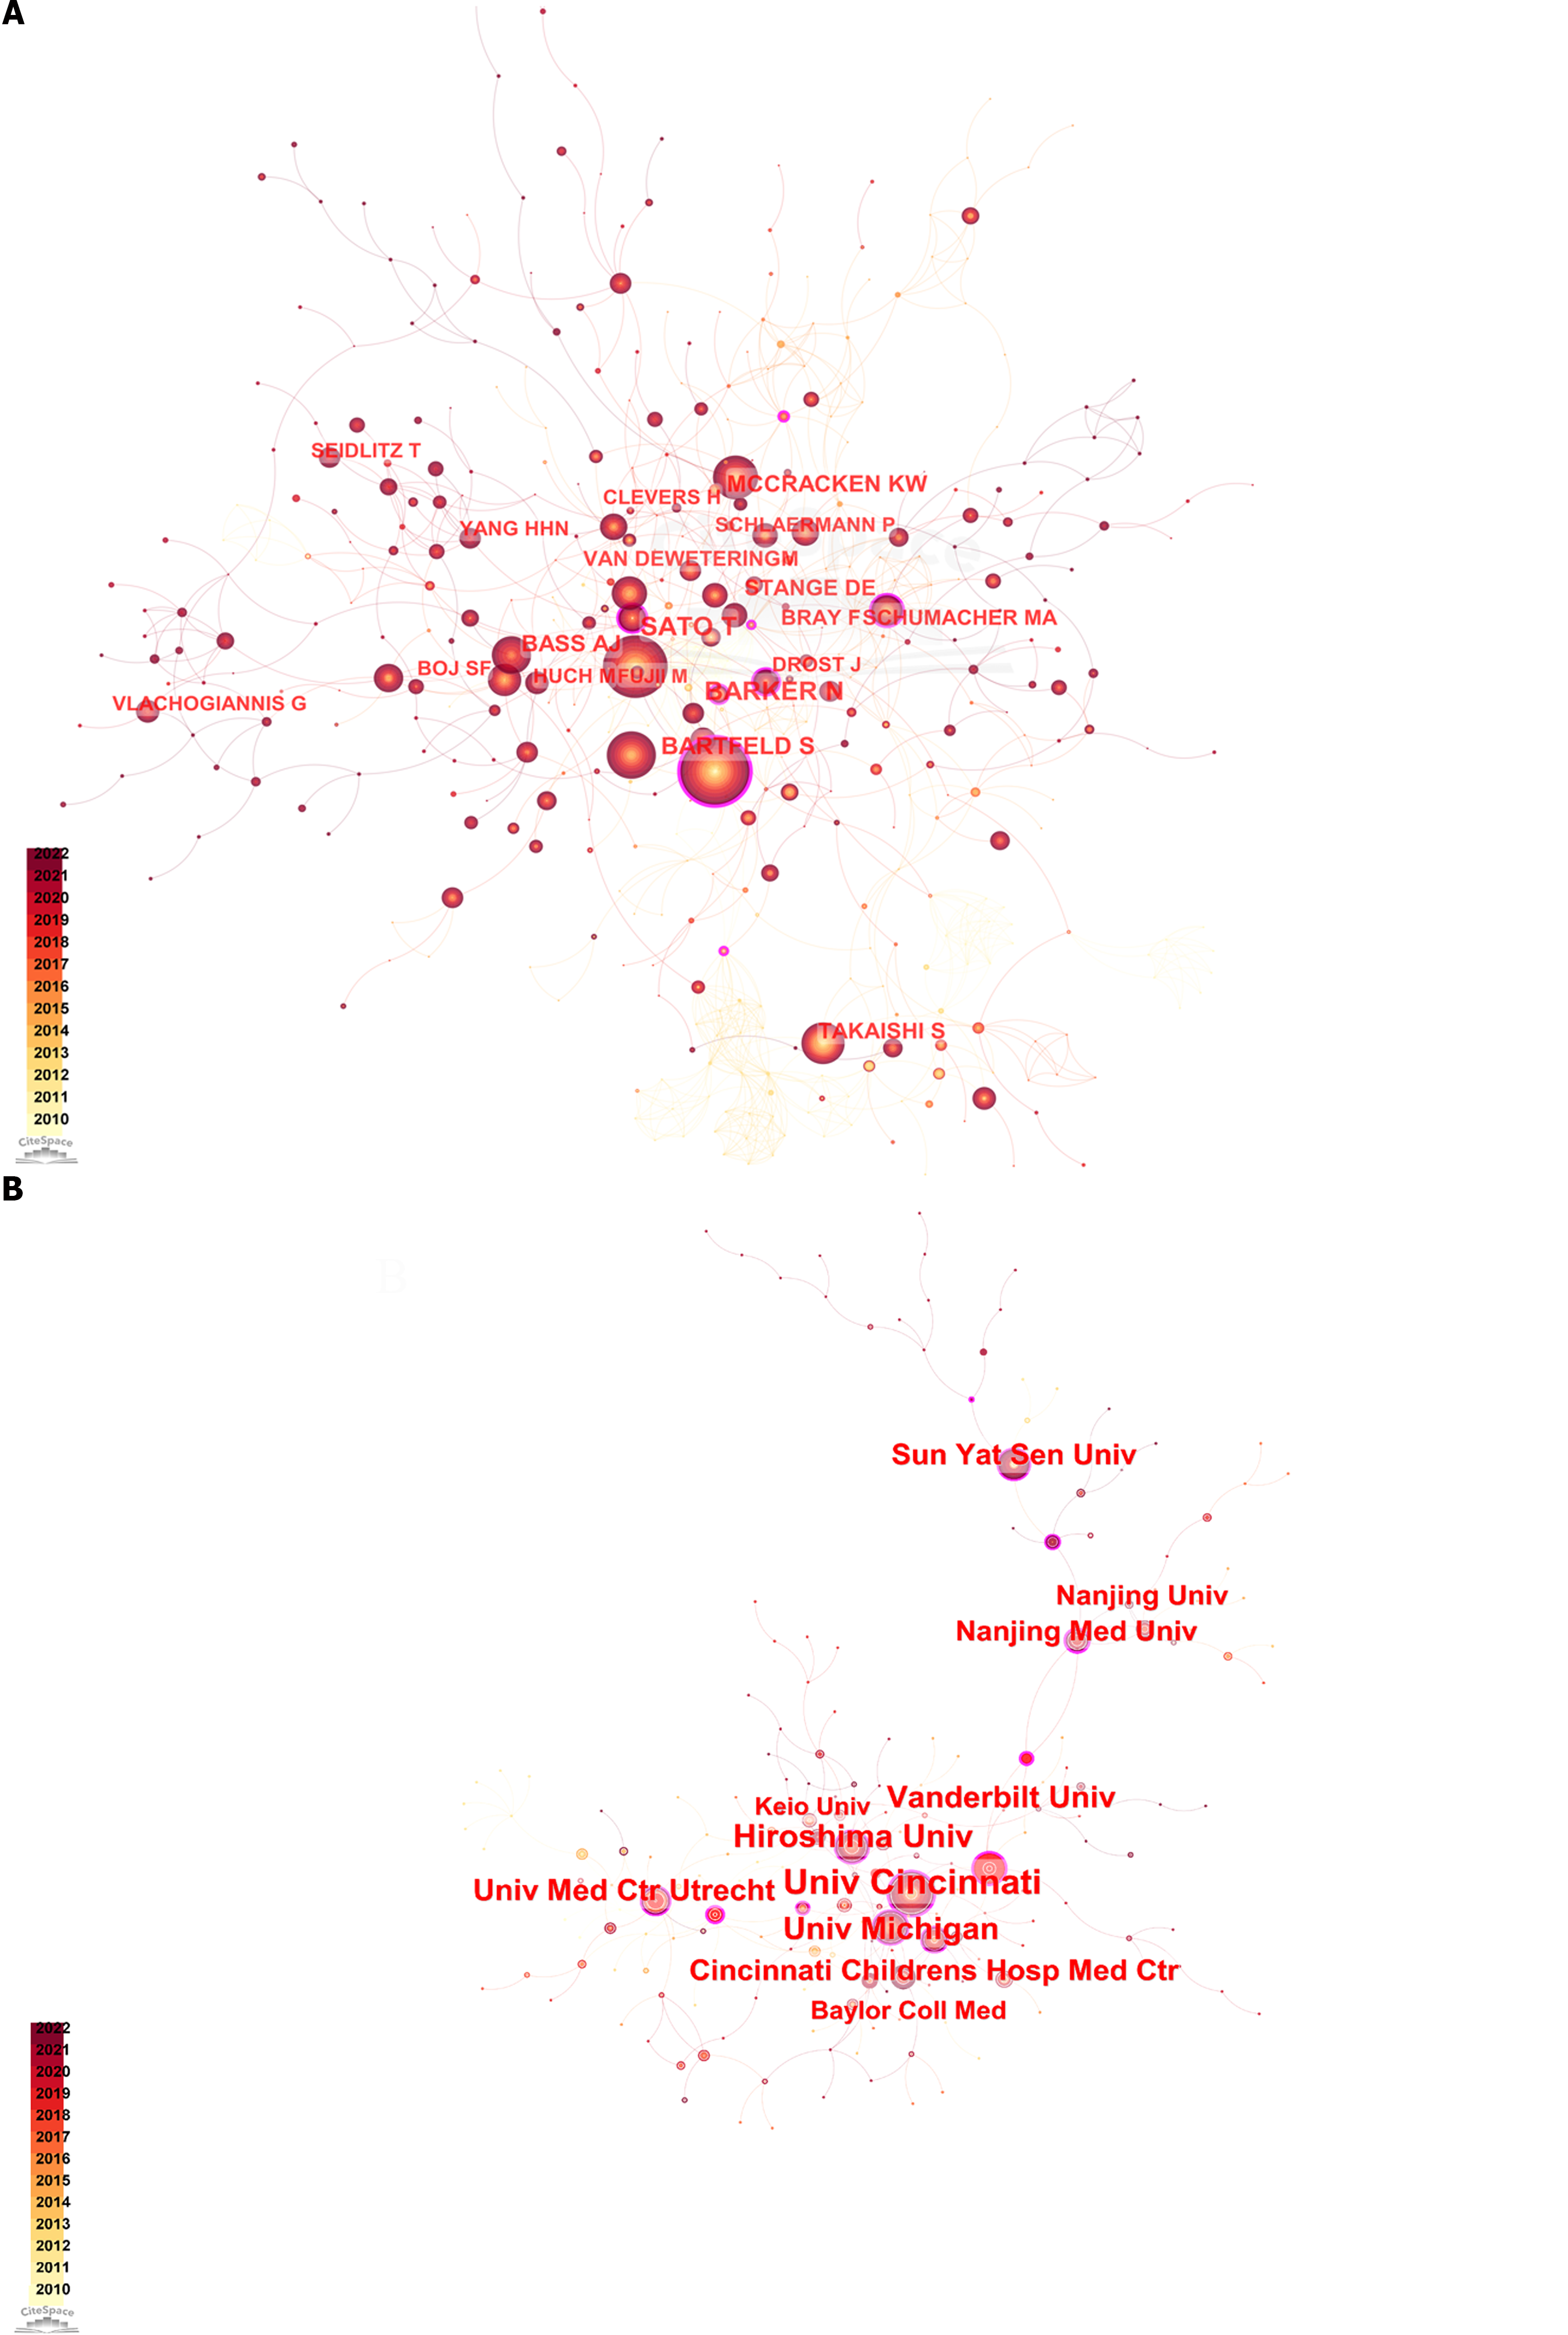
Figure 2 Network analysis of key scholars and institutions in gastric organoid research (2010-2023).
A: Depicts the collaboration and citation network among key scholars in the field, where the size of the nodes represents the citation count, and the color gradient indicates the year of publication (from light for 2010 to dark for 2023); B: The network positioning and relationships of major research institutions, with node size and color coding similarly representing the volume of citations and the temporal progression of research.
- Citation: Jiang KL, Jia YB, Liu XJ, Jia QL, Guo LK, Wang XX, Yang KM, Wu CH, Liang BB, Ling JH. Bibliometrics analysis based on the Web of Science: Current trends and perspective of gastric organoid during 2010-2023. World J Gastroenterol 2024; 30(8): 969-983
- URL: https://www.wjgnet.com/1007-9327/full/v30/i8/969.htm
- DOI: https://dx.doi.org/10.3748/wjg.v30.i8.969


