Copyright
©The Author(s) 2024.
World J Gastroenterol. Mar 21, 2024; 30(11): 1556-1571
Published online Mar 21, 2024. doi: 10.3748/wjg.v30.i11.1556
Published online Mar 21, 2024. doi: 10.3748/wjg.v30.i11.1556
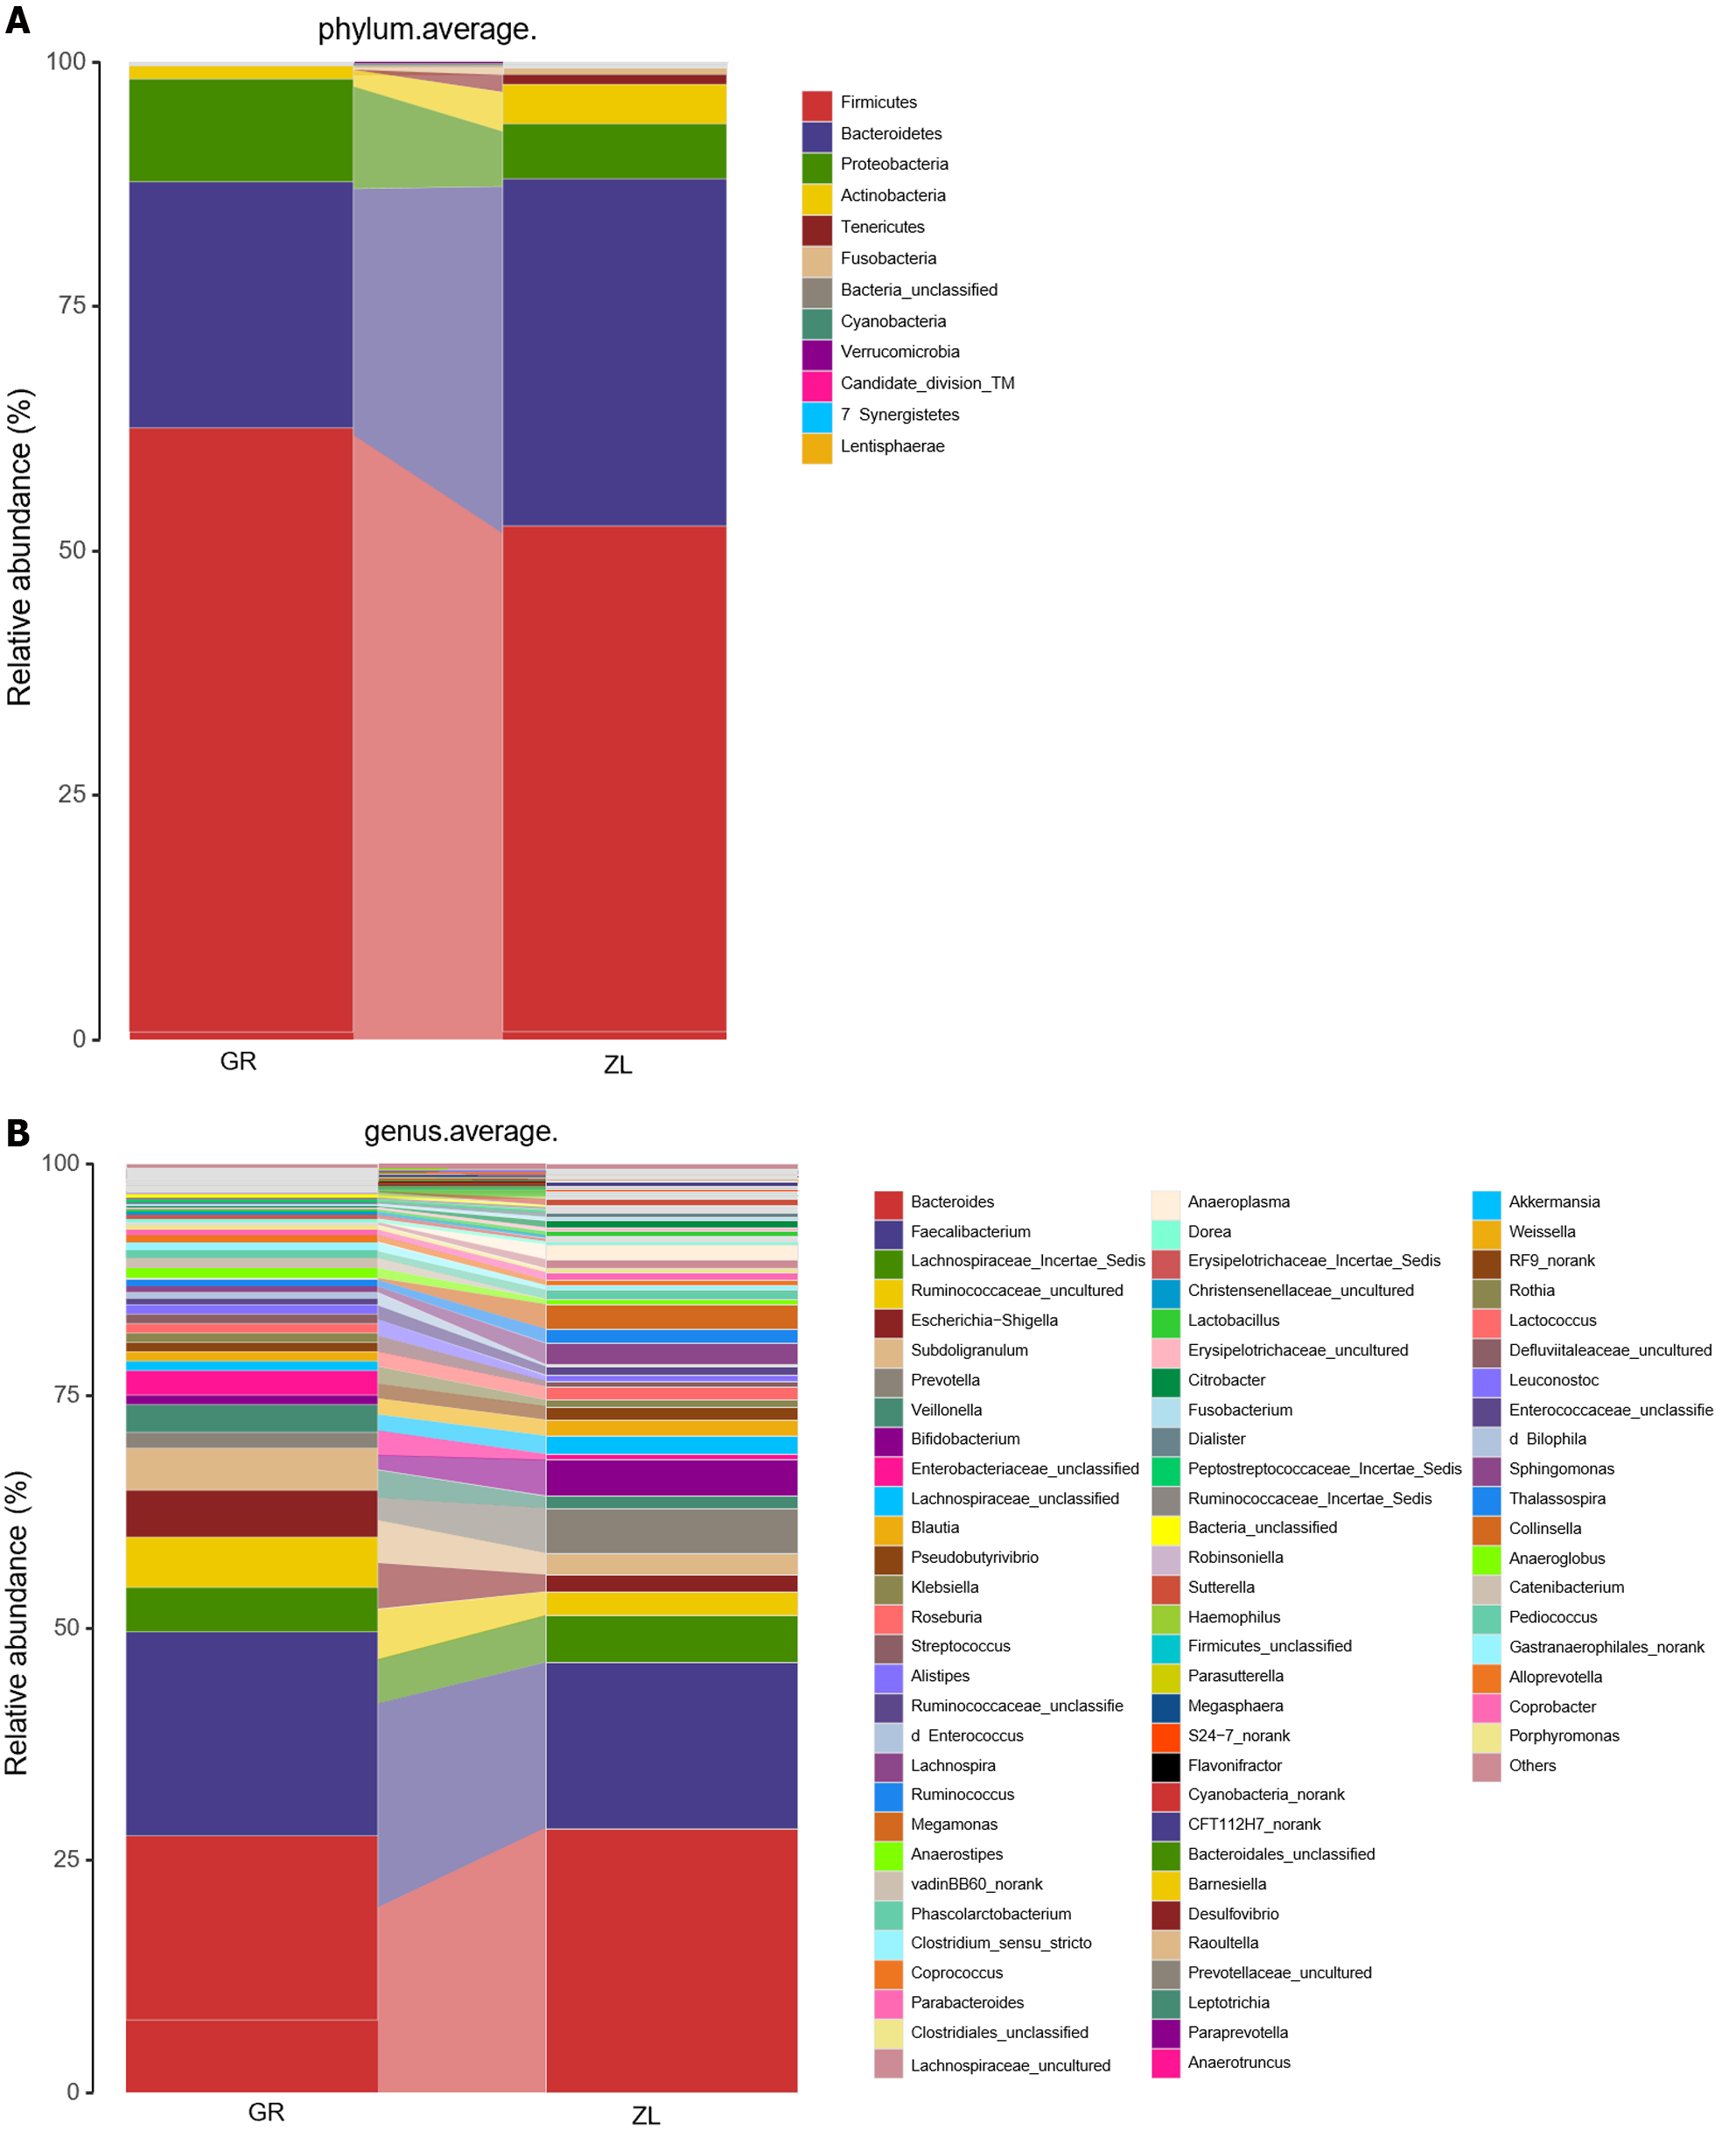
Figure 7 Plots of the relative abundance of the gut microbiota at the phylum and genus levels before and after treatment in all patients.
A: Plots of the relative abundance of the gut microbiota at the phylum levels before and after treatment in all patients; B: Plots of the relative abundance of gut microbiota at the genus levels before and after treatment in all patients. GR: Before treatment with Lactobacillus paracasei N1115 (LP N1115); ZL: 3 months after treatment with LP N1115.
- Citation: Hu YC, Ding XC, Liu HJ, Ma WL, Feng XY, Ma LN. Effects of Lactobacillus paracasei N1115 on gut microbial imbalance and liver function in patients with hepatitis B-related cirrhosis. World J Gastroenterol 2024; 30(11): 1556-1571
- URL: https://www.wjgnet.com/1007-9327/full/v30/i11/1556.htm
- DOI: https://dx.doi.org/10.3748/wjg.v30.i11.1556


