Copyright
©The Author(s) 2023.
World J Gastroenterol. Mar 7, 2023; 29(9): 1523-1535
Published online Mar 7, 2023. doi: 10.3748/wjg.v29.i9.1523
Published online Mar 7, 2023. doi: 10.3748/wjg.v29.i9.1523
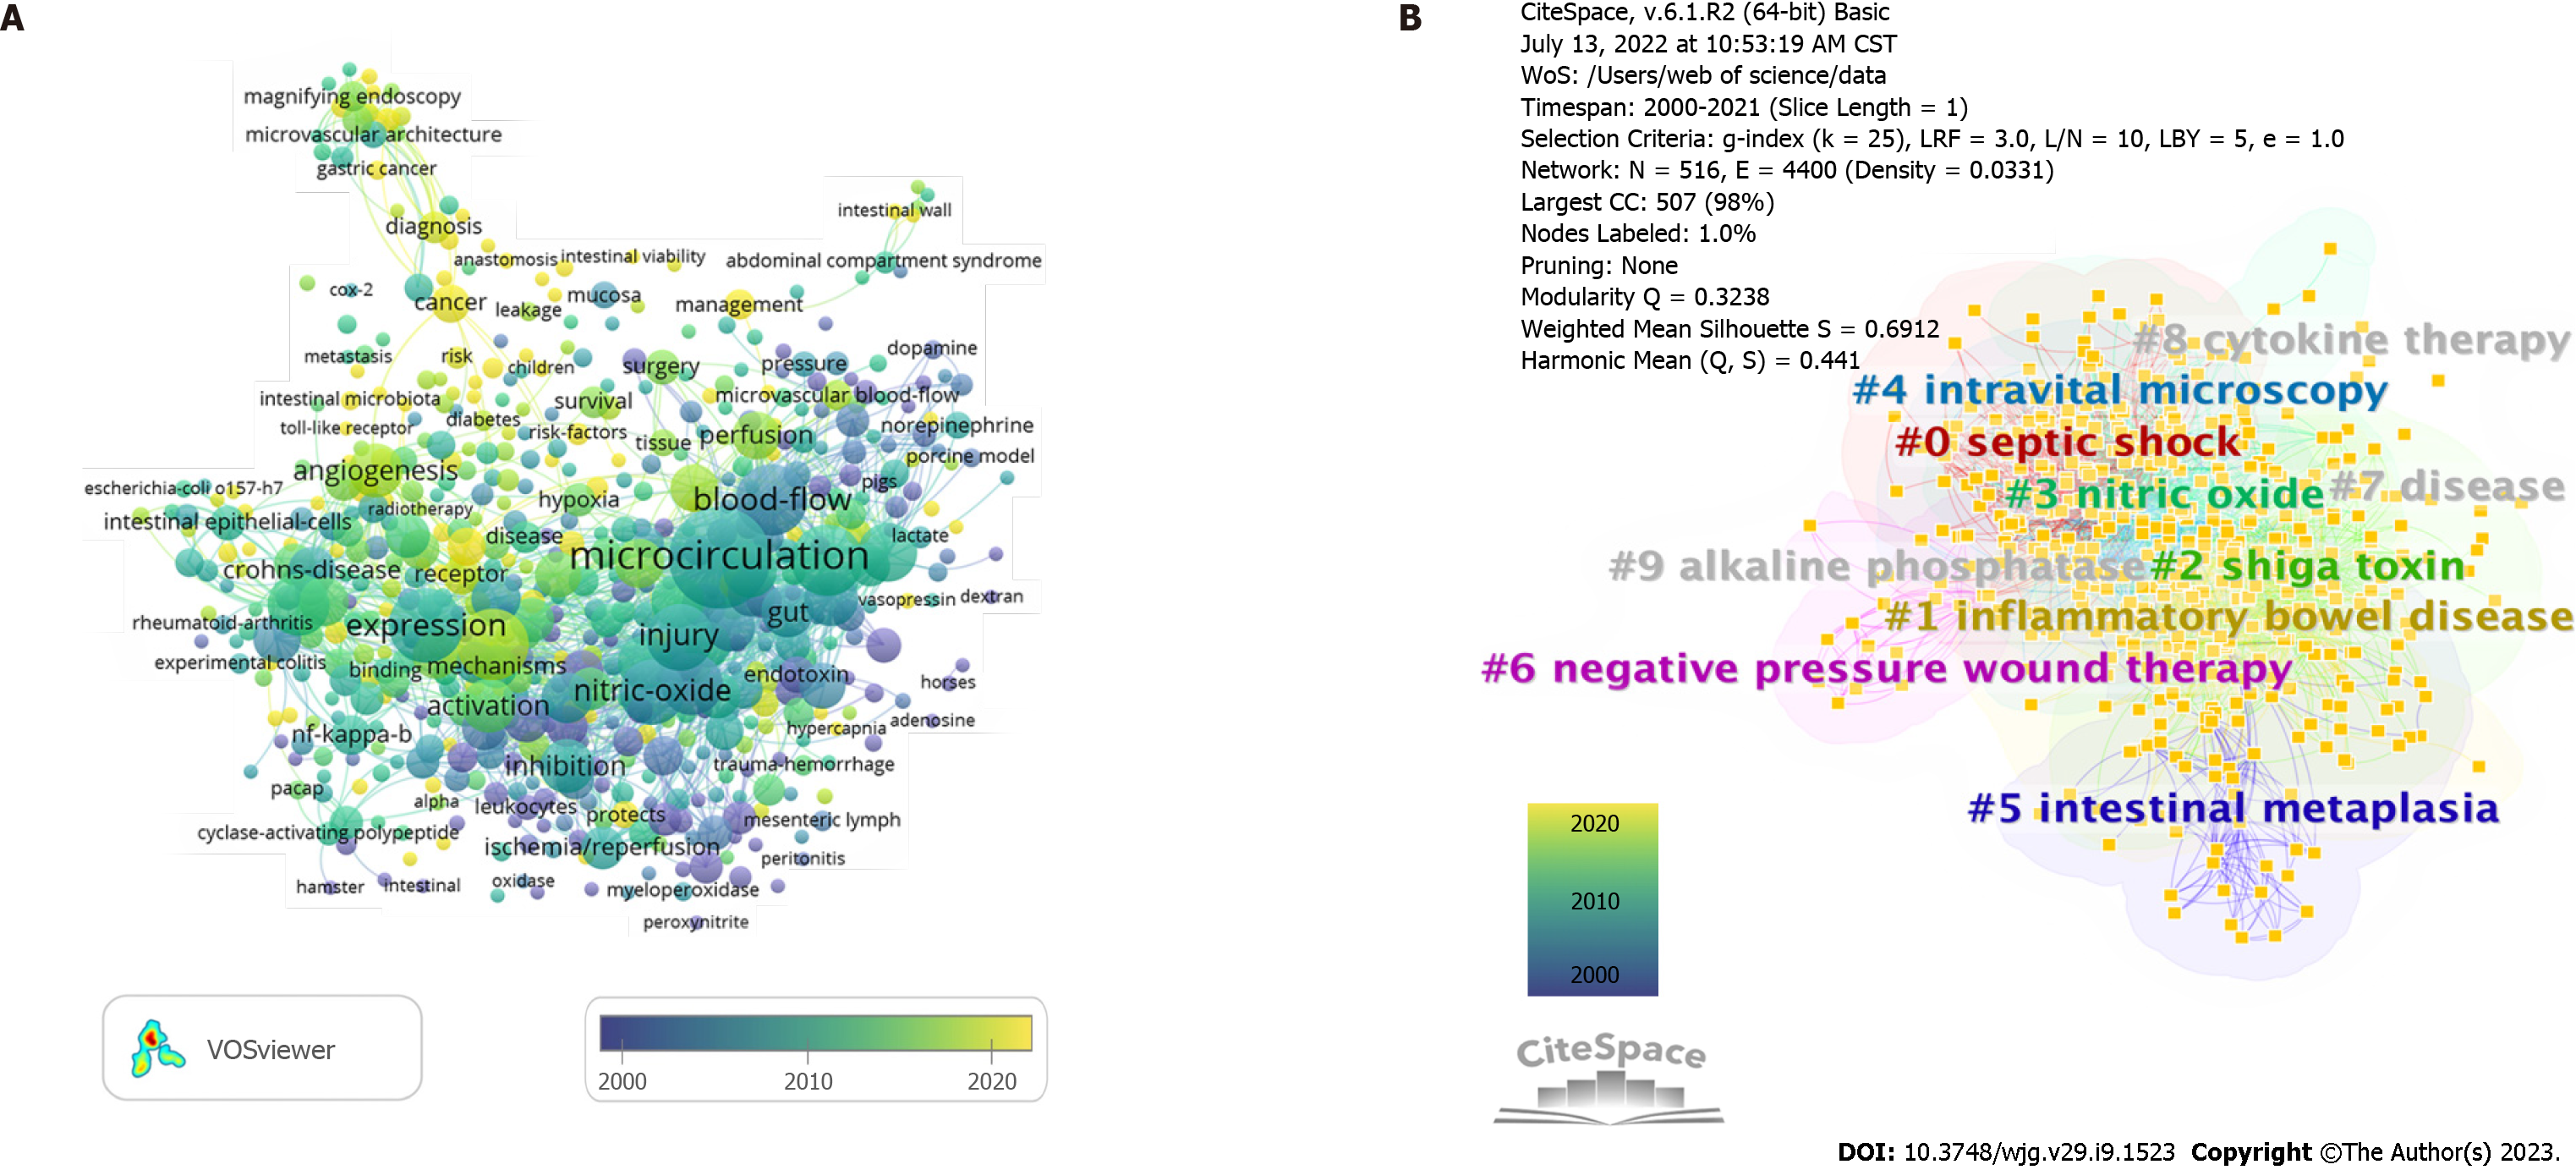
Figure 6 The network map of keywords in the intestinal microcirculatory research.
A: The co-occurrence map of keywords in the intestinal microcirculatory research. The graphical mapping of terms was created when setting the minimum number of keyword occurrences to 5. Of the 6607 keywords in the field, 572 reached this threshold. Each node represents a keyword, and the sizes of the node denote the number of occurrences of the keywords map. The transition from blue to yellow in the color bar depicts the years 2000 to 2021; B: The clustering map of keywords in the intestinal microcirculatory research. 10 clusters with diversified themes were formed and illustrated in different colors. Colors represent clusters of the close-working network. Silhouette = 0.3238. Modularity Q = 0.6912.
- Citation: Fu SJ, Xu MT, Wang B, Li BW, Ling H, Li Y, Wang Q, Liu XT, Zhang XY, Li AL, Liu MM. Global trend and future landscape of intestinal microcirculation research from 2000 to 2021: A scientometric study. World J Gastroenterol 2023; 29(9): 1523-1535
- URL: https://www.wjgnet.com/1007-9327/full/v29/i9/1523.htm
- DOI: https://dx.doi.org/10.3748/wjg.v29.i9.1523


