Copyright
©The Author(s) 2023.
World J Gastroenterol. Feb 28, 2023; 29(8): 1359-1373
Published online Feb 28, 2023. doi: 10.3748/wjg.v29.i8.1359
Published online Feb 28, 2023. doi: 10.3748/wjg.v29.i8.1359
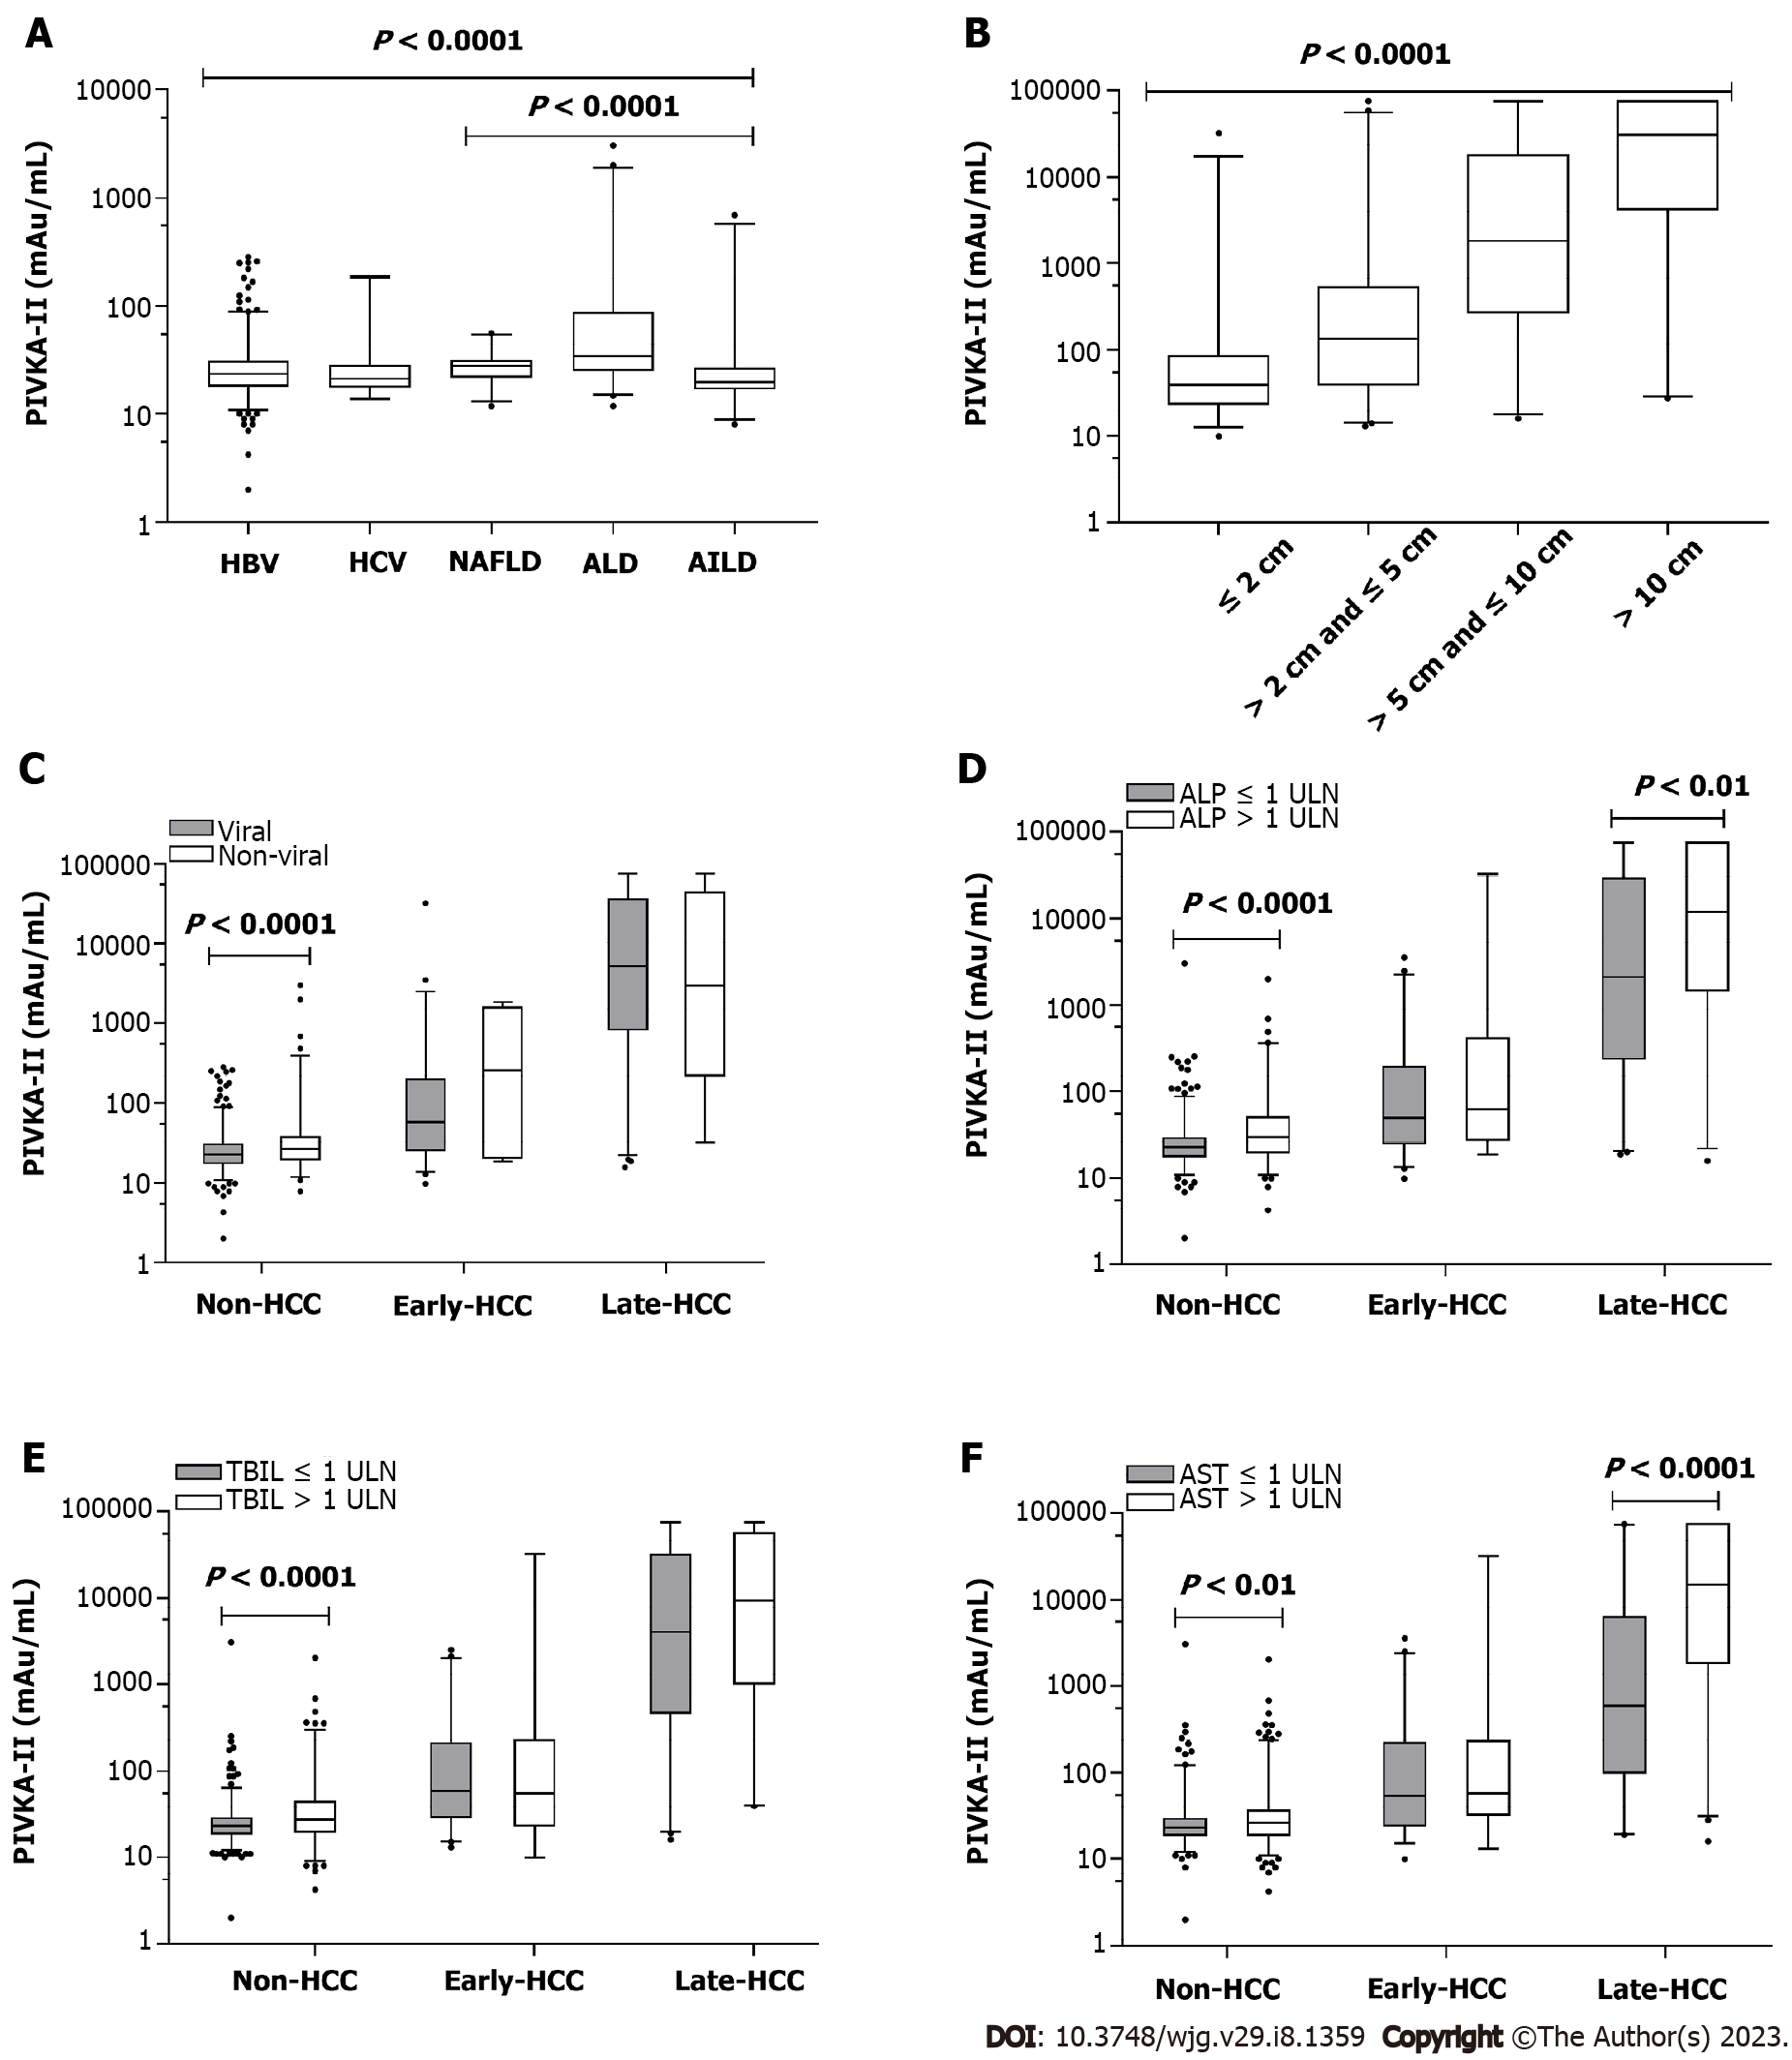
Figure 2 Distributions and comparisons of serum protein induced by vitamin K absence or antagonist-II in different subgroups.
A: Different etiologies of hepatitis B virus (HBV), HCV, nonalcoholic fatty liver disease, alcohol-related liver disease (ALD), autoimmune liver disease; B: Different tumor sizes of ≤ 2 cm (n = 60), > 2 cm and ≤ 5 cm (n = 88), > 5 cm and ≤ 10 cm (n = 65), > 10 cm (n = 54); C: Subgroups between viral and nonviral liver diseases; D: Subgroups between alkaline phosphatase (ALP) ≤ 1 × upper limit of normal (ULN) and ALP > 1 × ULN; E: Subgroups between total bilirubin (TBIL) ≤ 1 × ULN and TBIL > 1 × ULN; F: Subgroups between aspartate aminotransferase (AST) ≤ 1 × ULN and AST > 1 × ULN. HCC: Hepatocellular carcinoma; HBV: Hepatitis B virus; HCV: Hepatitis C virus; NAFLD: Nonalcoholic fatty liver disease; ALD: Alcohol-related liver disease; AILD: Autoimmune liver disease; ALT: Alanine aminotransferase; AST: Aspartate aminotransferase; ALP: Alkaline phosphatase; ULN: Upper limit of normal; TBIL: Total bilirubin.
- Citation: Qian XJ, Wen ZM, Huang XM, Feng HJ, Lin SS, Liu YN, Li SC, Zhang Y, Peng WG, Yang JR, Zheng ZY, Zhang L, Zhang DW, Lu FM, Liu LJ, Pan WD. Better performance of PIVKA-II for detecting hepatocellular carcinoma in patients with chronic liver disease with normal total bilirubin. World J Gastroenterol 2023; 29(8): 1359-1373
- URL: https://www.wjgnet.com/1007-9327/full/v29/i8/1359.htm
- DOI: https://dx.doi.org/10.3748/wjg.v29.i8.1359


