Copyright
©The Author(s) 2023.
World J Gastroenterol. Feb 28, 2023; 29(8): 1315-1329
Published online Feb 28, 2023. doi: 10.3748/wjg.v29.i8.1315
Published online Feb 28, 2023. doi: 10.3748/wjg.v29.i8.1315
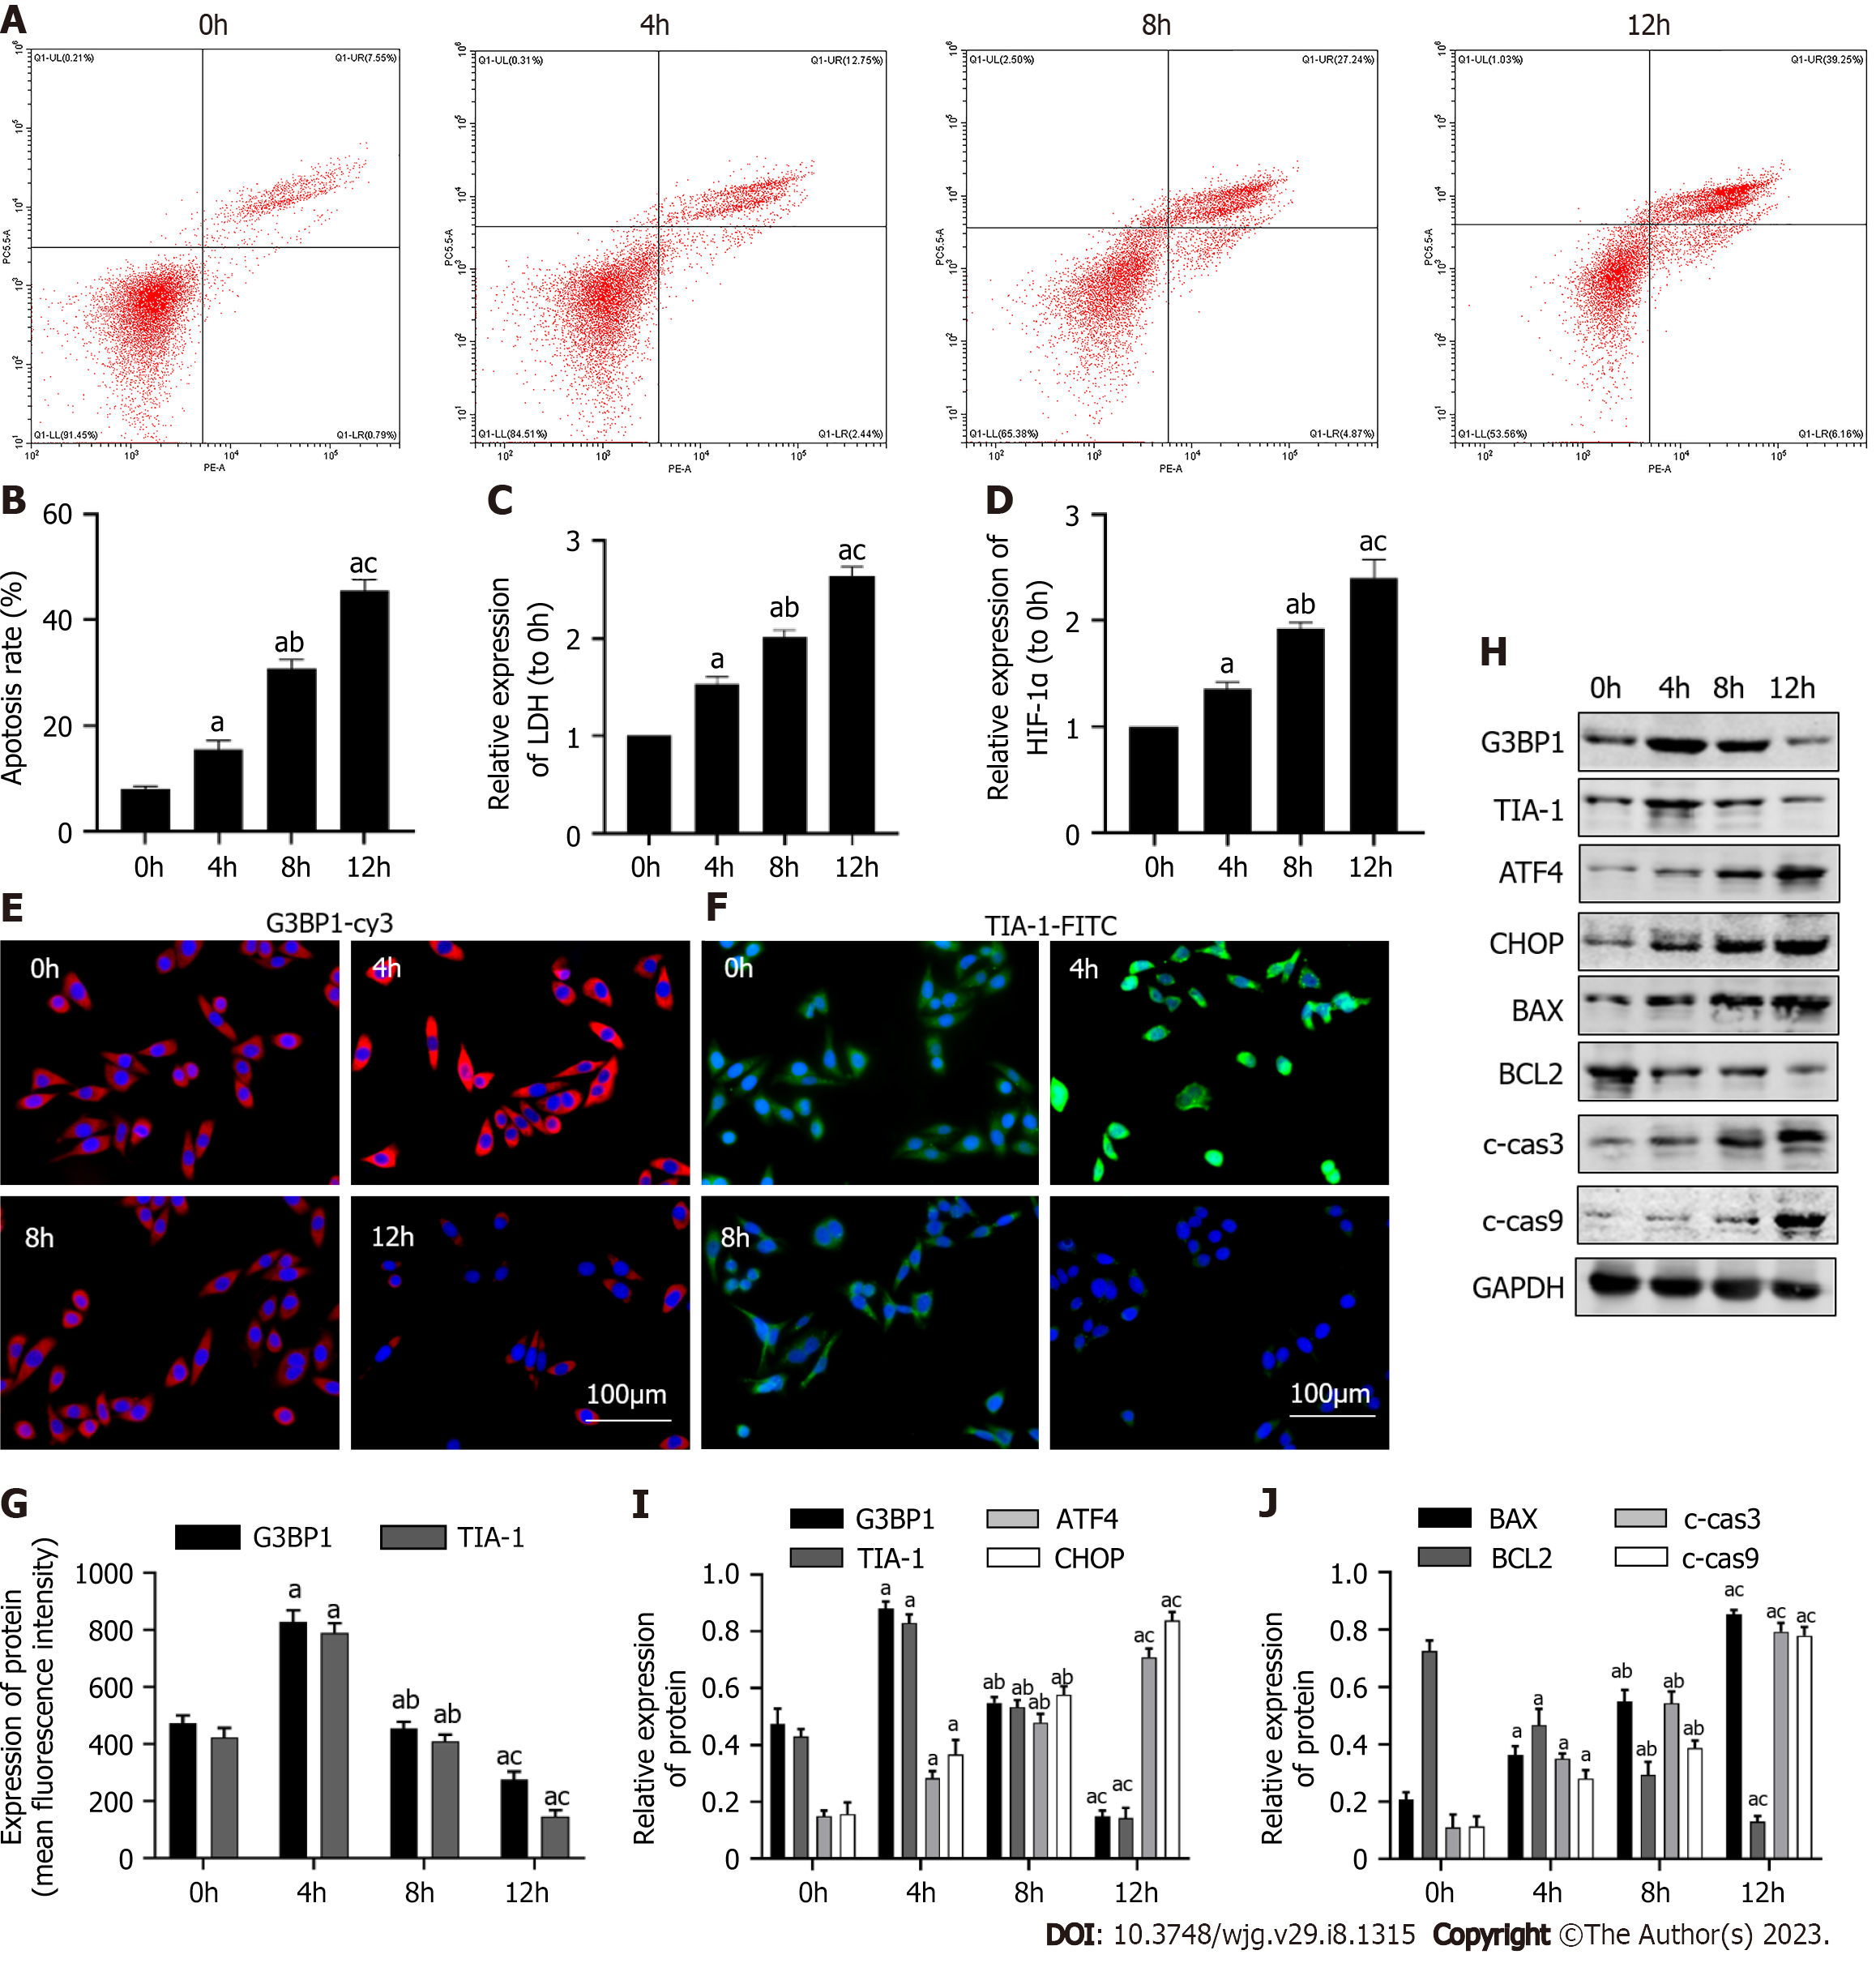
Figure 1 Changes of stress granules, endoplasmic reticulum stress and apoptosis levels with the change of hypoxia time.
A and B: The level of apoptosis was detected by flow cytometry; C and D: The detection kits were used to evaluate the content of HIF-1α in homogenates, lactate dehydrogenase in cell supernatant; E: The expression of G3BP1 in cells was detected by immunofluorescence; F: The expression of TIA-1 in cells was detected by immunofluorescence; G: The histogram displays the amount of molecules expression; H-J: The protein expression levels of G3BP1, TIA-1, ATF4, CHOP, BAX, BCL2, c-cas3 and c-cas9 was detected by western blot. n = 3. Data was shown mean ± SD. aP < 0.05 vs 0 h group; bP < 0.05 vs 4 h group; cP < 0.05 vs 8 h group.
- Citation: Li WY, Yang F, Li X, Wang LW, Wang Y. Stress granules inhibit endoplasmic reticulum stress-mediated apoptosis during hypoxia-induced injury in acute liver failure. World J Gastroenterol 2023; 29(8): 1315-1329
- URL: https://www.wjgnet.com/1007-9327/full/v29/i8/1315.htm
- DOI: https://dx.doi.org/10.3748/wjg.v29.i8.1315


