Copyright
©The Author(s) 2023.
World J Gastroenterol. Nov 21, 2023; 29(43): 5804-5817
Published online Nov 21, 2023. doi: 10.3748/wjg.v29.i43.5804
Published online Nov 21, 2023. doi: 10.3748/wjg.v29.i43.5804
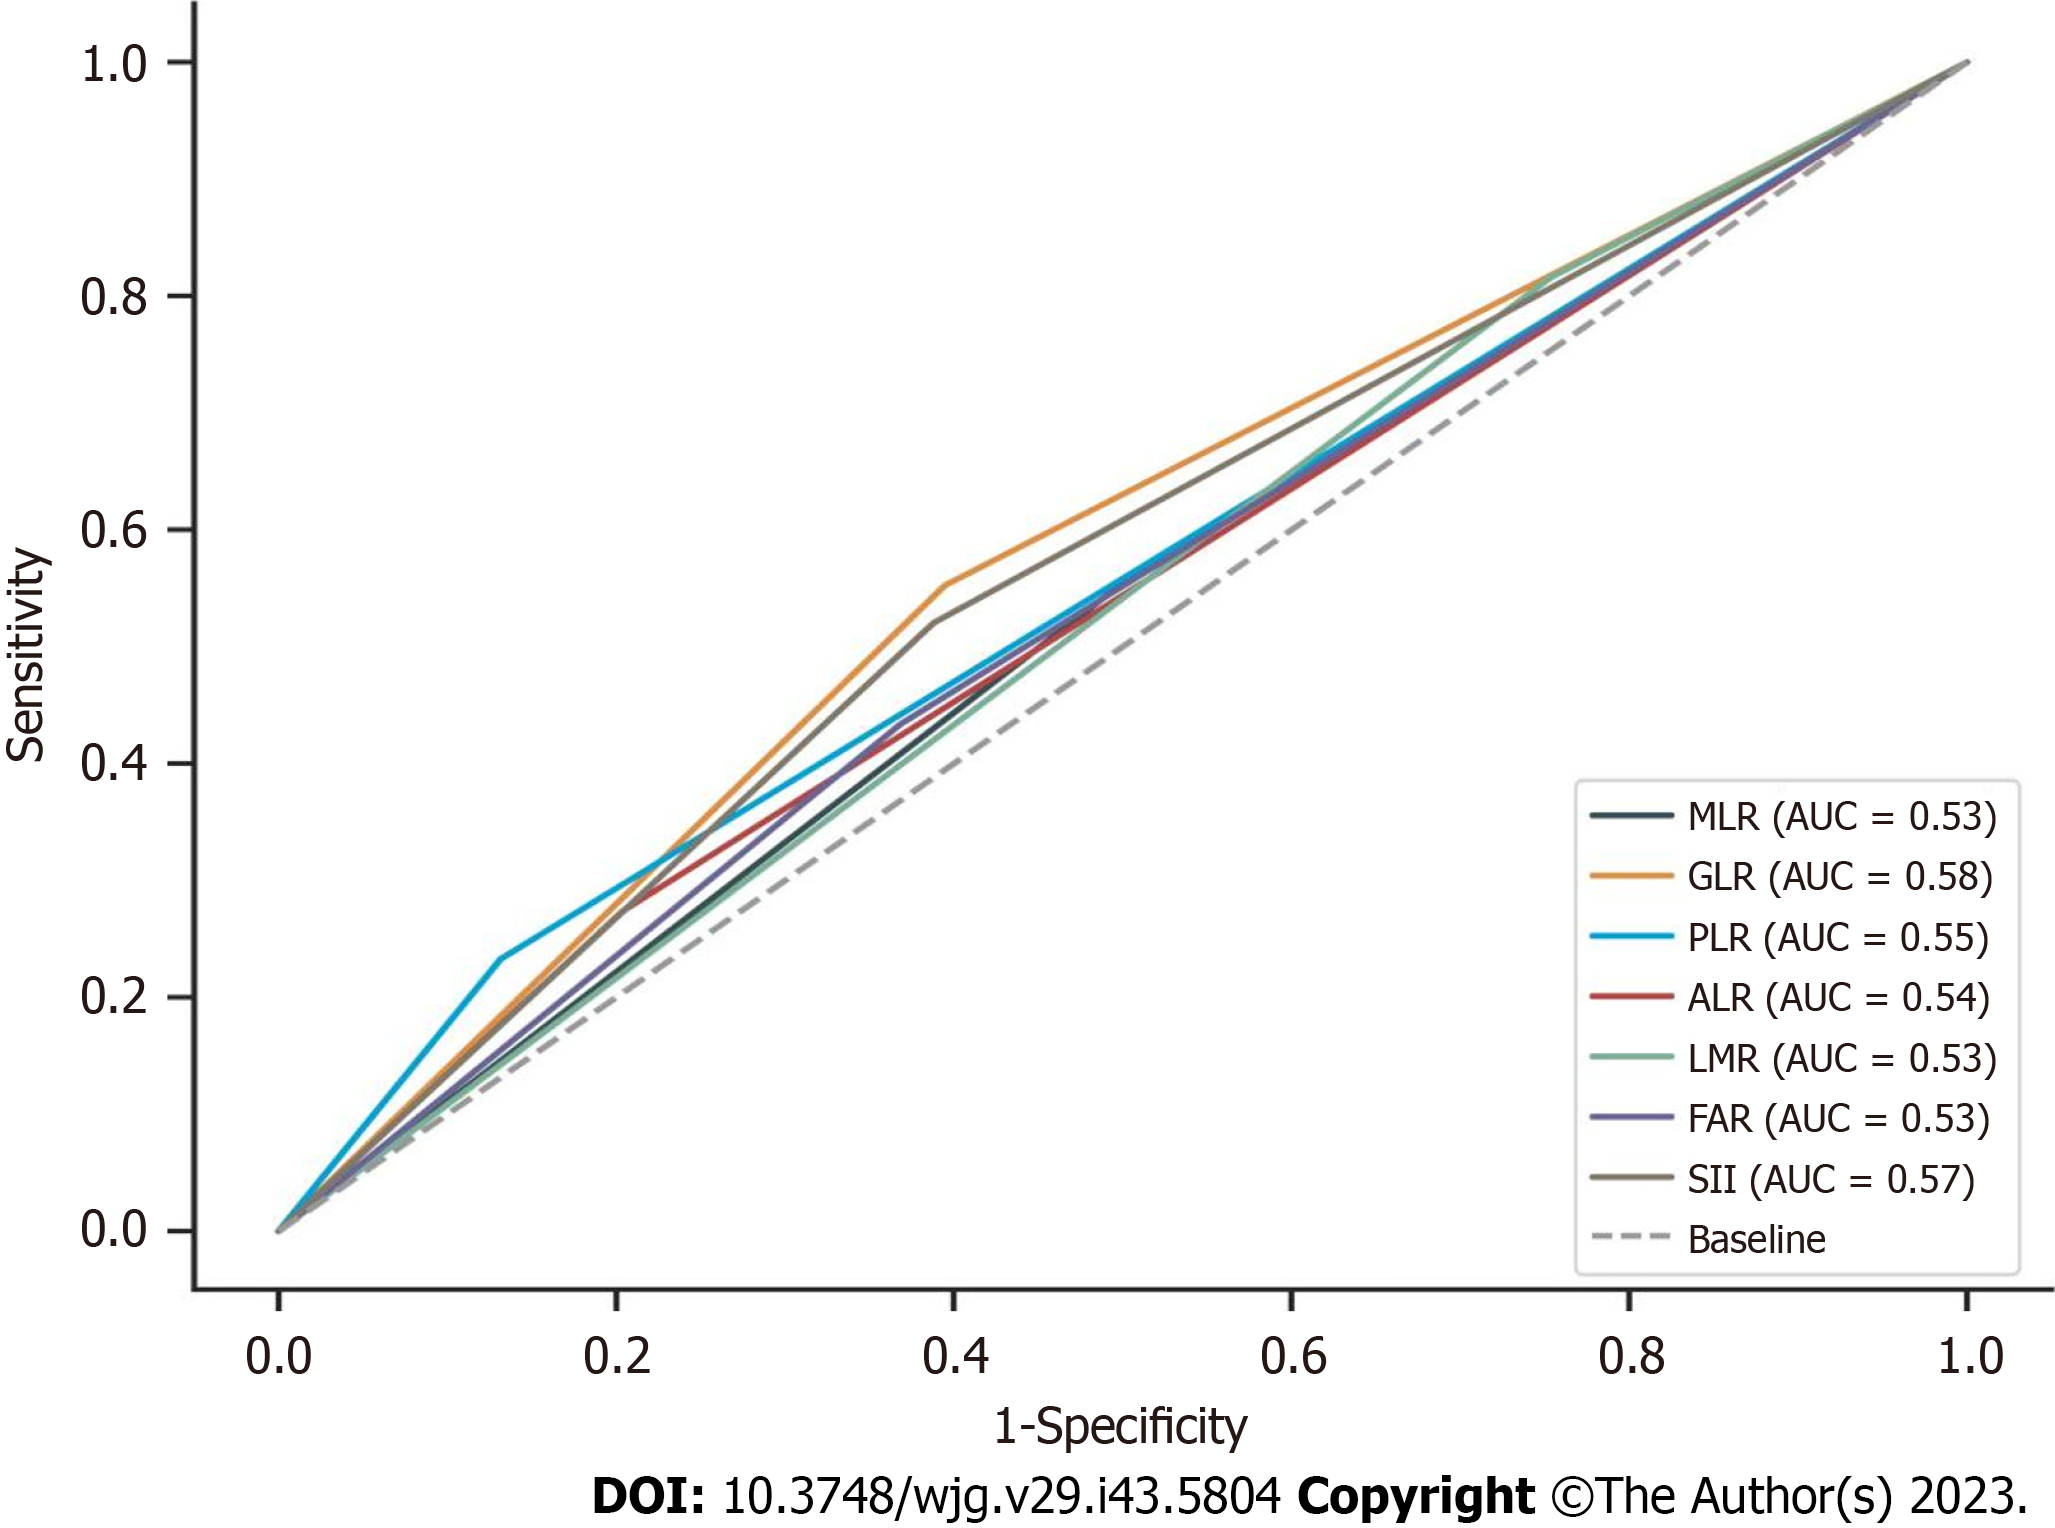
Figure 3 Receiver operating characteristic curve analyses of diagnostic performance of monocyte to lymphocyte ratio, γ-glutamyl transferase to lymphocyte ratio, platelet count to lymphocyte count ratio, alkaline phosphatase to lymphocyte count ratio, lymphocyte to monocyte count ratio, fibrinogen to albumin level ratio, or systemic immune-inflammation index.
AUC: Area under the curve; MLR: Monocyte to lymphocyte ratio; GLR: γ-glutamyl transferase to lymphocyte ratio; PLR: Platelet count to lymphocyte count ratio; ALR: Alkaline phosphatase to lymphocyte count ratio; LMR: Lymphocyte to monocyte count; FAR: Fibrinogen to albumin level ratio; SII: Systemic immune-inflammation index.
- Citation: Zhang YB, Yang G, Bu Y, Lei P, Zhang W, Zhang DY. Development of a machine learning-based model for predicting risk of early postoperative recurrence of hepatocellular carcinoma. World J Gastroenterol 2023; 29(43): 5804-5817
- URL: https://www.wjgnet.com/1007-9327/full/v29/i43/5804.htm
- DOI: https://dx.doi.org/10.3748/wjg.v29.i43.5804


