Copyright
©The Author(s) 2023.
World J Gastroenterol. Sep 14, 2023; 29(34): 5054-5074
Published online Sep 14, 2023. doi: 10.3748/wjg.v29.i34.5054
Published online Sep 14, 2023. doi: 10.3748/wjg.v29.i34.5054
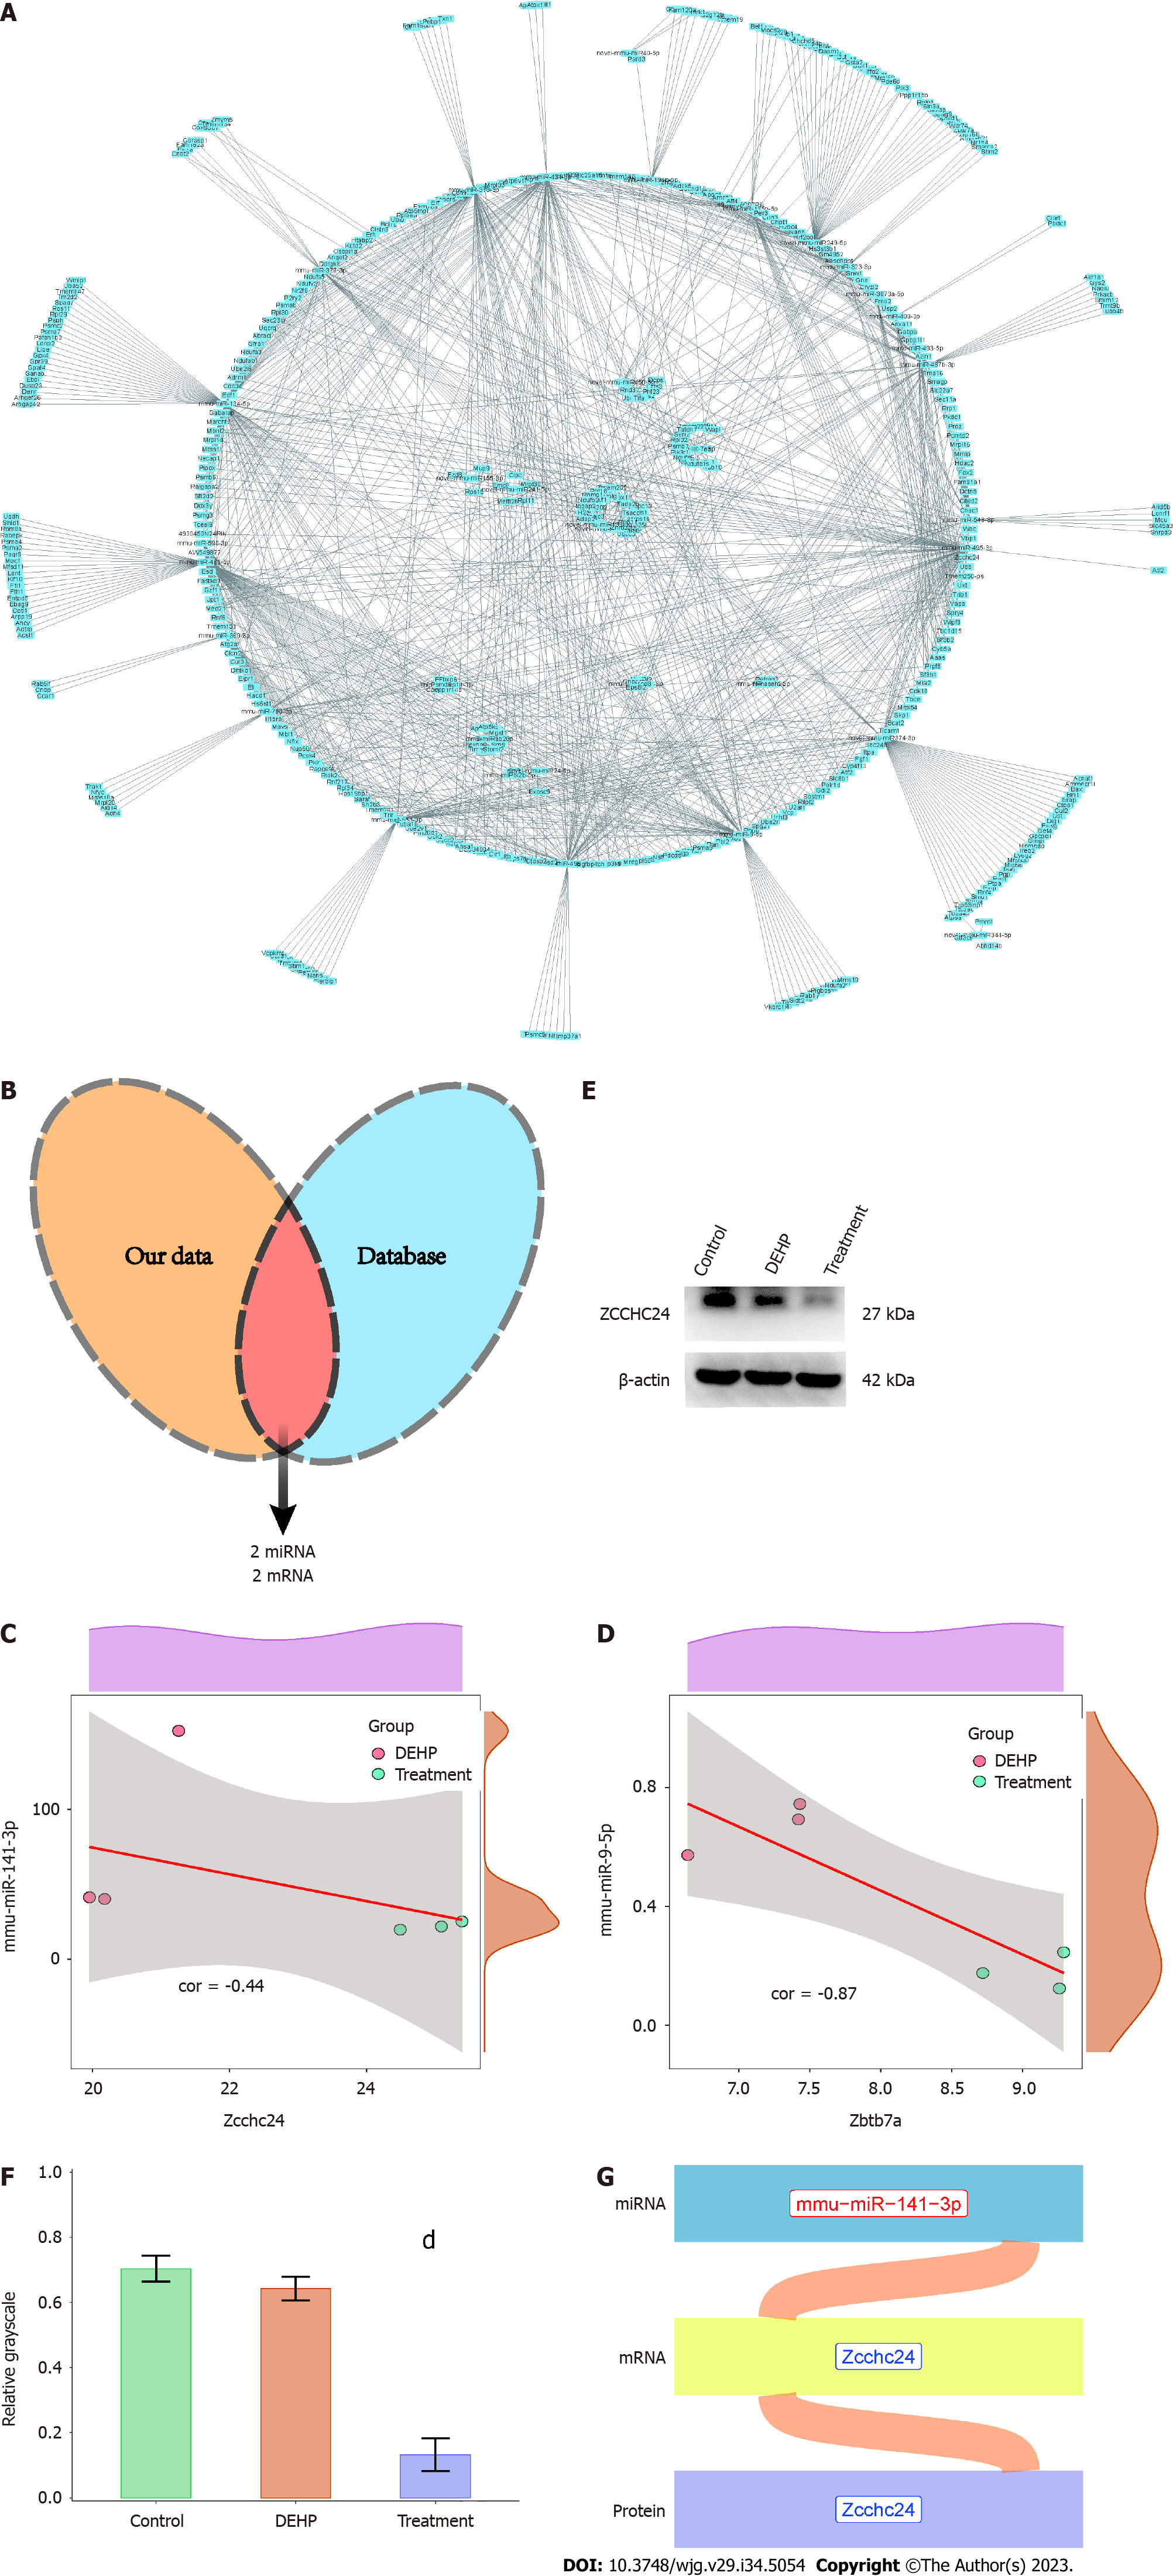
Figure 10 Construction of the microRNA-mRNA-protein regulatory axis.
A: The network diagram was constructed using differentially expressed mRNAs and microRNAs (miRNAs); B: Wayne diagram indicating the intersection of the miRNA-mRNA regulatory axis and mouse interaction network from the starBase database; C: Correlation analyses of mmu-miR-141-3p and Zcchc24; D: Correlation analyses of mmu-miR-9-5p and Zbtb7a; E: Western blotting validation of Zcchc24 protein expression in the control, model, and treatment groups; F: Semiquantitative analysis of Zcchc24 protein levels in the control, model, and treatment groups; G: The Sankey plot of the miRNA-mRNA-protein regulatory axes mediating the suppressive effects of green tea polyphenols (GTPs) on di-(2-ethylhexyl) phthalate (DEHP)-induced liver damage in mice. Red and blue fonts indicate upregulated and downregulated expression, respectively. dP < 0.01 (compared to DEHP group). DEHP: Di (2-ethylhexyl) phthalate; GTPs: Green tea polyphenols.
- Citation: Shi H, Zhao XH, Peng Q, Zhou XL, Liu SS, Sun CC, Cao QY, Zhu SP, Sun SY. Green tea polyphenols alleviate di-(2-ethylhexyl) phthalate-induced liver injury in mice. World J Gastroenterol 2023; 29(34): 5054-5074
- URL: https://www.wjgnet.com/1007-9327/full/v29/i34/5054.htm
- DOI: https://dx.doi.org/10.3748/wjg.v29.i34.5054


