Copyright
©The Author(s) 2023.
World J Gastroenterol. Sep 14, 2023; 29(34): 5054-5074
Published online Sep 14, 2023. doi: 10.3748/wjg.v29.i34.5054
Published online Sep 14, 2023. doi: 10.3748/wjg.v29.i34.5054
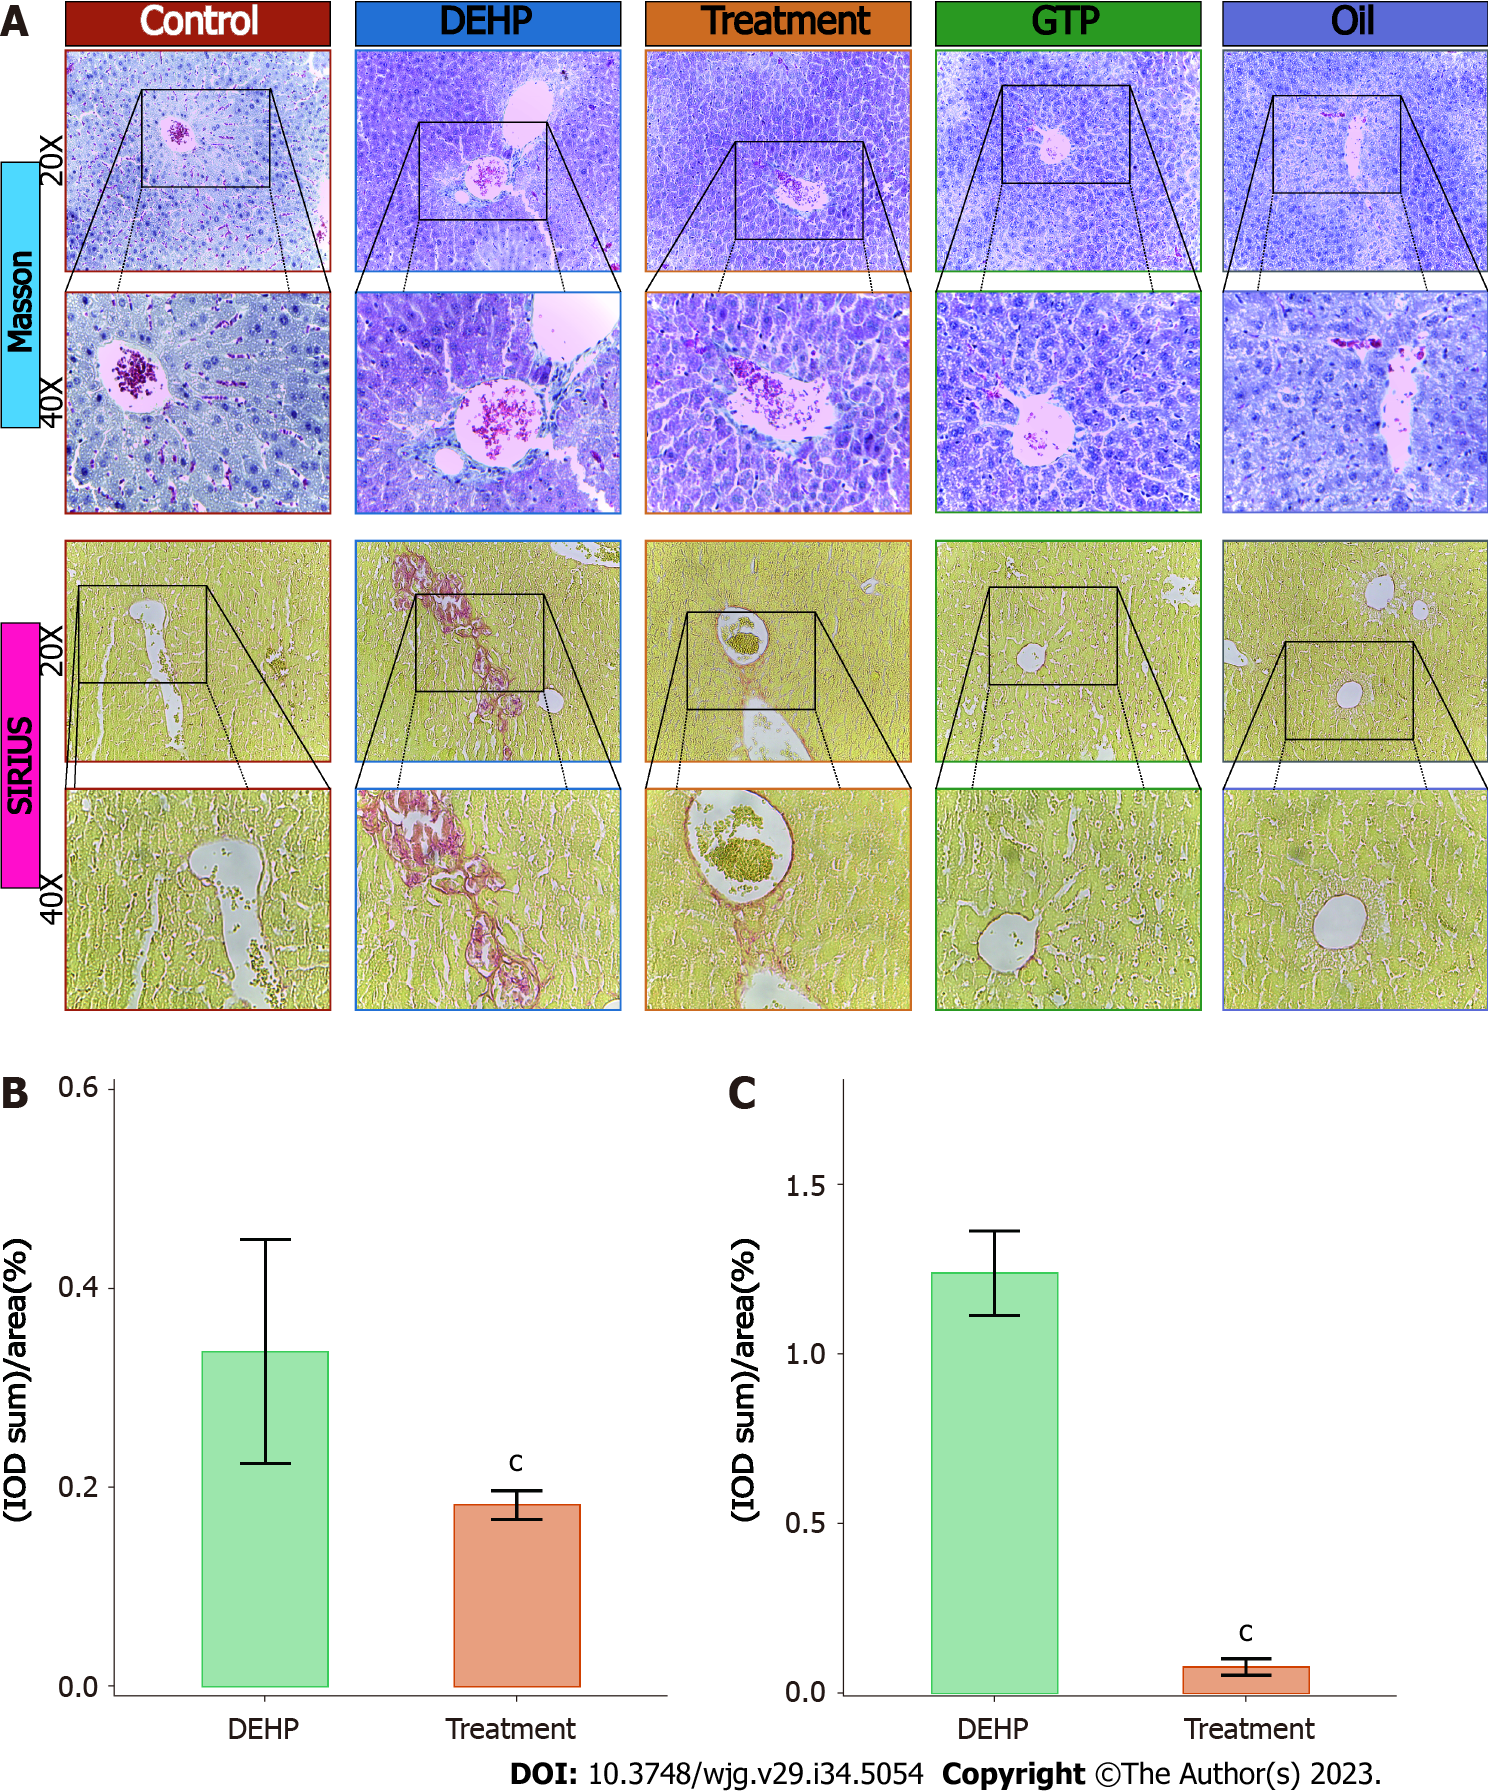
Figure 4 Masson’s trichrome and Sirius red staining and semiquantitative analysis of hepatic pathologies in mice from different groups.
A: Masson’s trichrome and Sirius red staining of liver samples from different groups; B and C: Comparative analysis of average optical density of Masson’s trichrome staining (B) and Sirius red staining (C) intensities between the model and treatment groups. cP < 0.05 (compared to Di (2-ethylhexyl) phthalate group). DEHP: Di (2-ethylhexyl) phthalate.
- Citation: Shi H, Zhao XH, Peng Q, Zhou XL, Liu SS, Sun CC, Cao QY, Zhu SP, Sun SY. Green tea polyphenols alleviate di-(2-ethylhexyl) phthalate-induced liver injury in mice. World J Gastroenterol 2023; 29(34): 5054-5074
- URL: https://www.wjgnet.com/1007-9327/full/v29/i34/5054.htm
- DOI: https://dx.doi.org/10.3748/wjg.v29.i34.5054


