Copyright
©The Author(s) 2023.
World J Gastroenterol. Sep 14, 2023; 29(34): 5054-5074
Published online Sep 14, 2023. doi: 10.3748/wjg.v29.i34.5054
Published online Sep 14, 2023. doi: 10.3748/wjg.v29.i34.5054
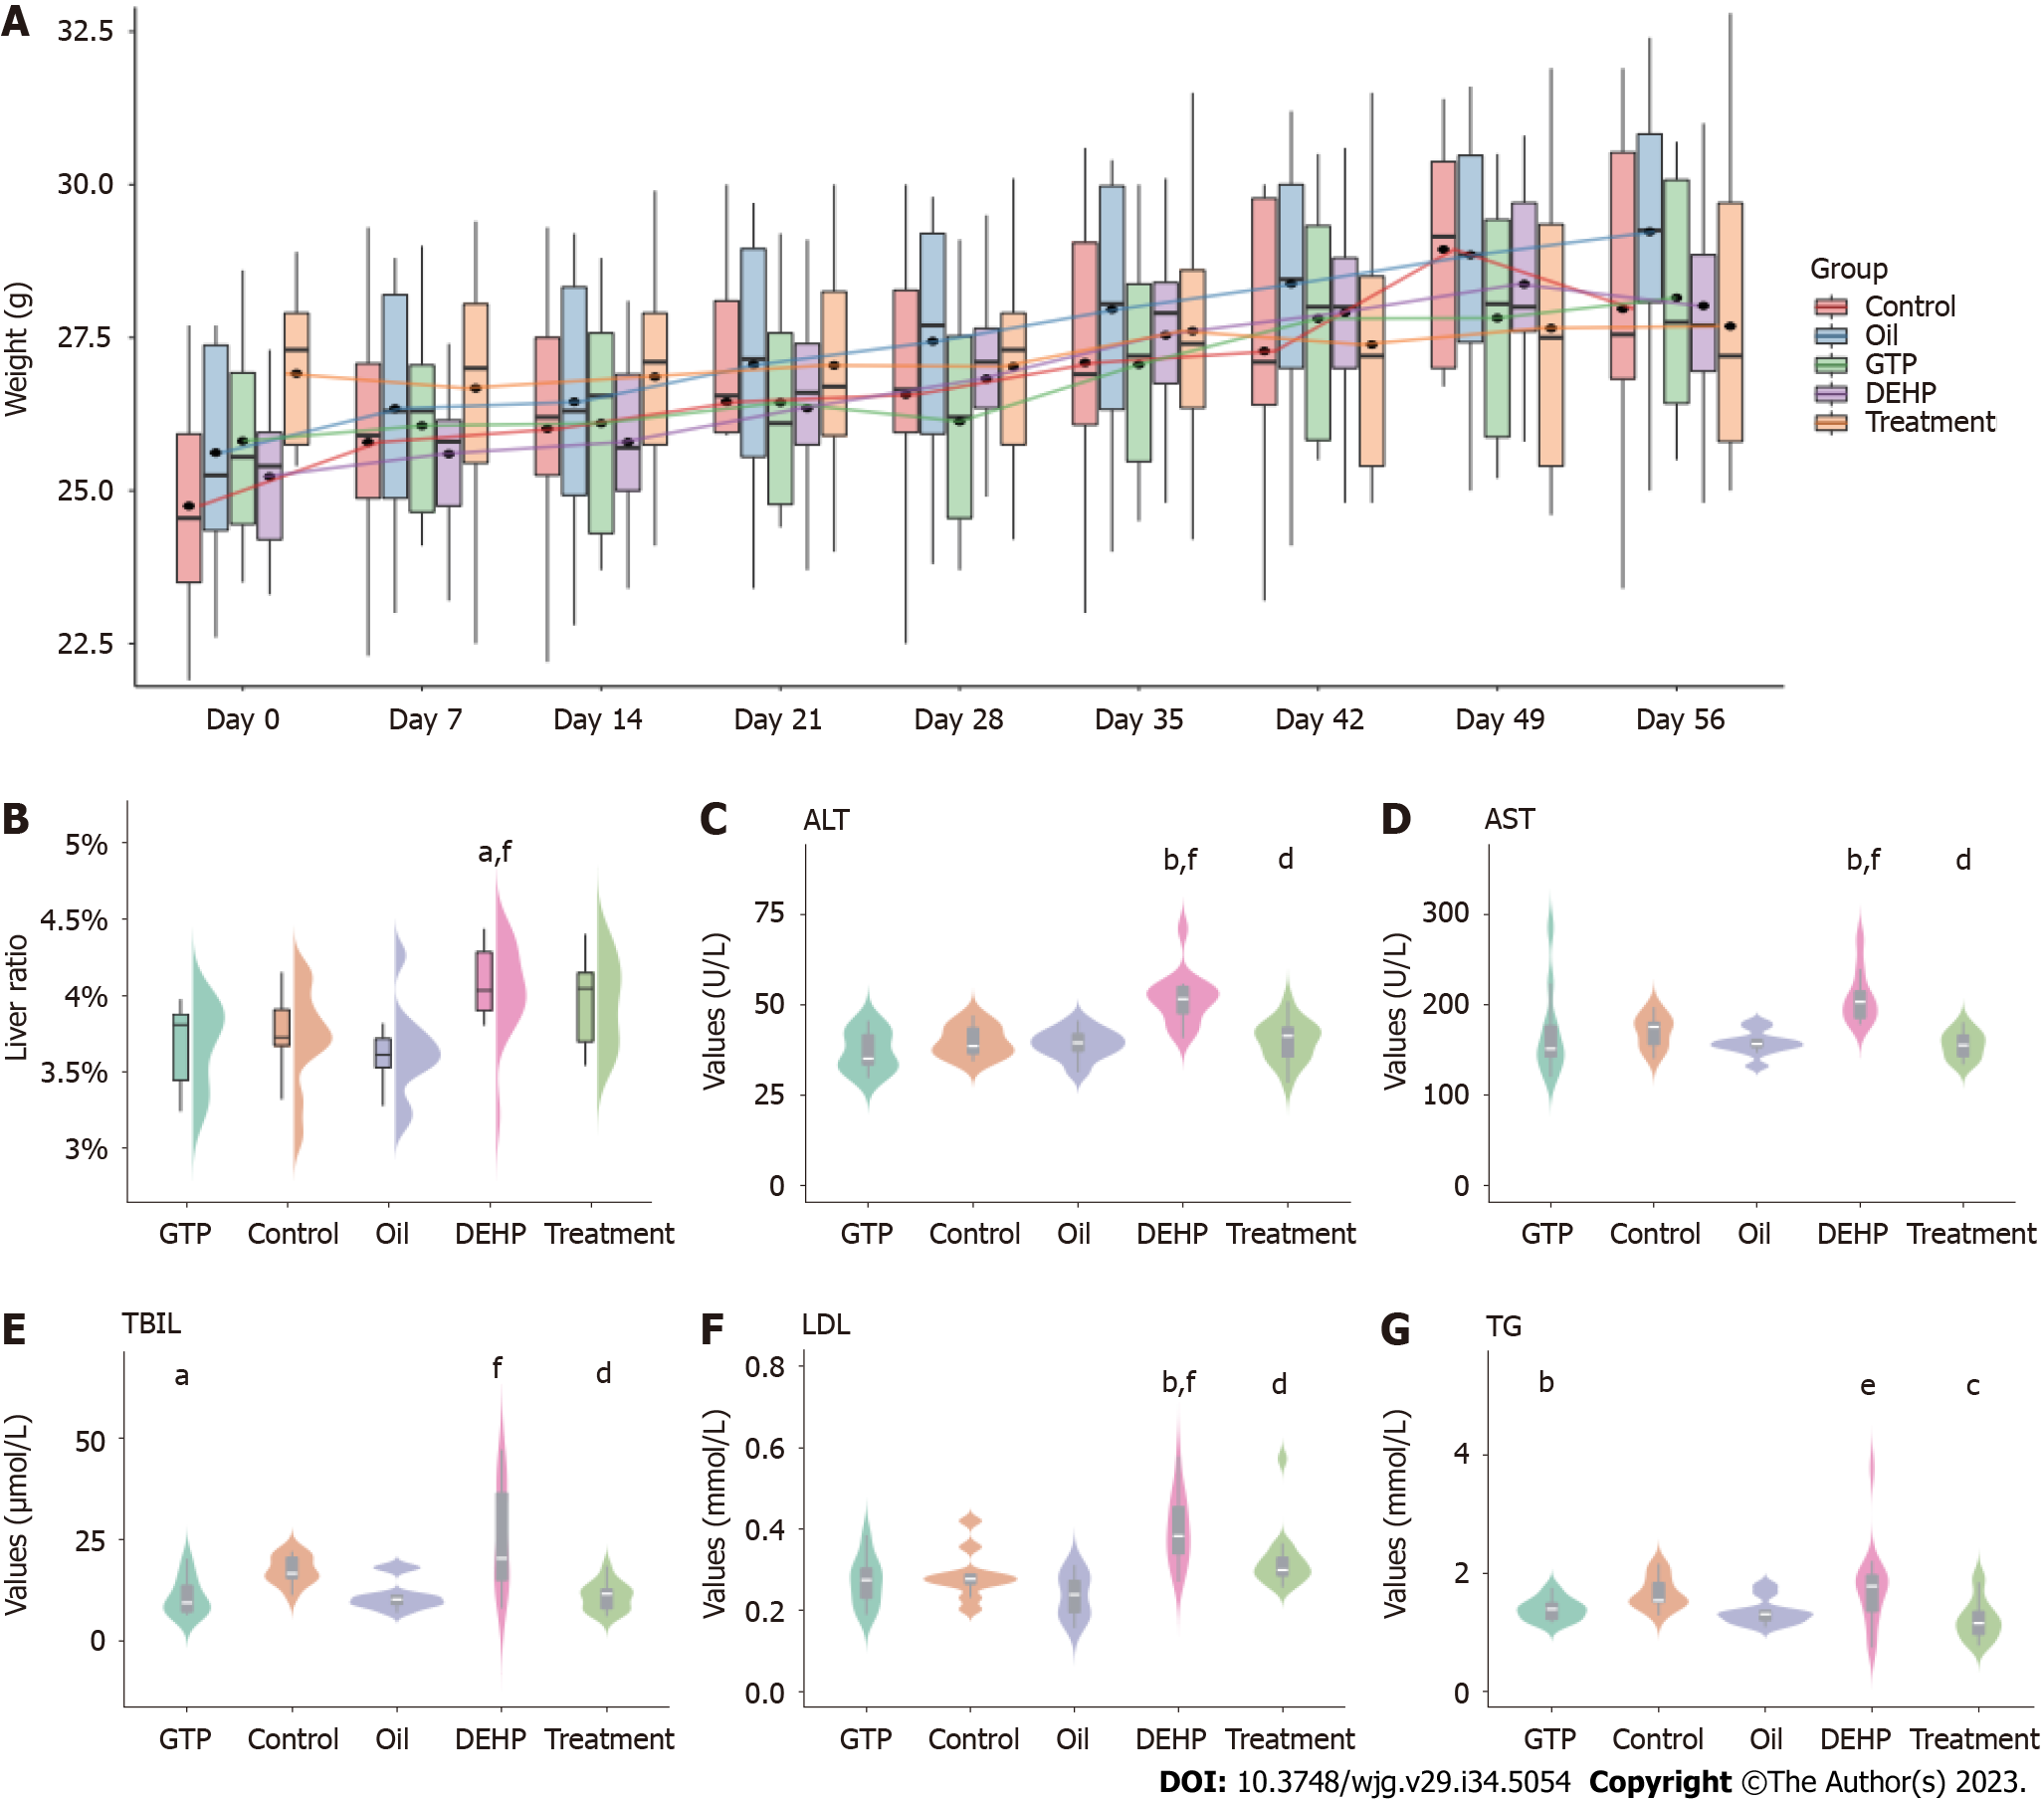
Figure 2 Mouse bodyweight and liver index and serum levels of liver function markers and lipids.
A: Bodyweight changes in different groups within 8 wk; B-G: Comparative analysis of organ indices (B) and serum levels of alanine aminotransferase (C), glutamate aminotransferase (D), total bilirubin (E), low-density lipoprotein (F), and triglyceride (G) in different groups. aP < 0.05 and bP < 0.01 (compared to the Control group); cP < 0.05 and dP < 0.01 (compared to Di (2-ethylhexyl) phthalate group); eP < 0.05 and fP < 0.01 (compared to Oil group). ALT: Alanine aminotransferase; AST: Glutamate aminotransferase; TBIL: Total bilirubin; LDL: Low-density lipoprotein; TG: Triglyceride; DEHP: Di (2-ethylhexyl) phthalate.
- Citation: Shi H, Zhao XH, Peng Q, Zhou XL, Liu SS, Sun CC, Cao QY, Zhu SP, Sun SY. Green tea polyphenols alleviate di-(2-ethylhexyl) phthalate-induced liver injury in mice. World J Gastroenterol 2023; 29(34): 5054-5074
- URL: https://www.wjgnet.com/1007-9327/full/v29/i34/5054.htm
- DOI: https://dx.doi.org/10.3748/wjg.v29.i34.5054


