Copyright
©The Author(s) 2023.
World J Gastroenterol. Jun 28, 2023; 29(24): 3899-3921
Published online Jun 28, 2023. doi: 10.3748/wjg.v29.i24.3899
Published online Jun 28, 2023. doi: 10.3748/wjg.v29.i24.3899
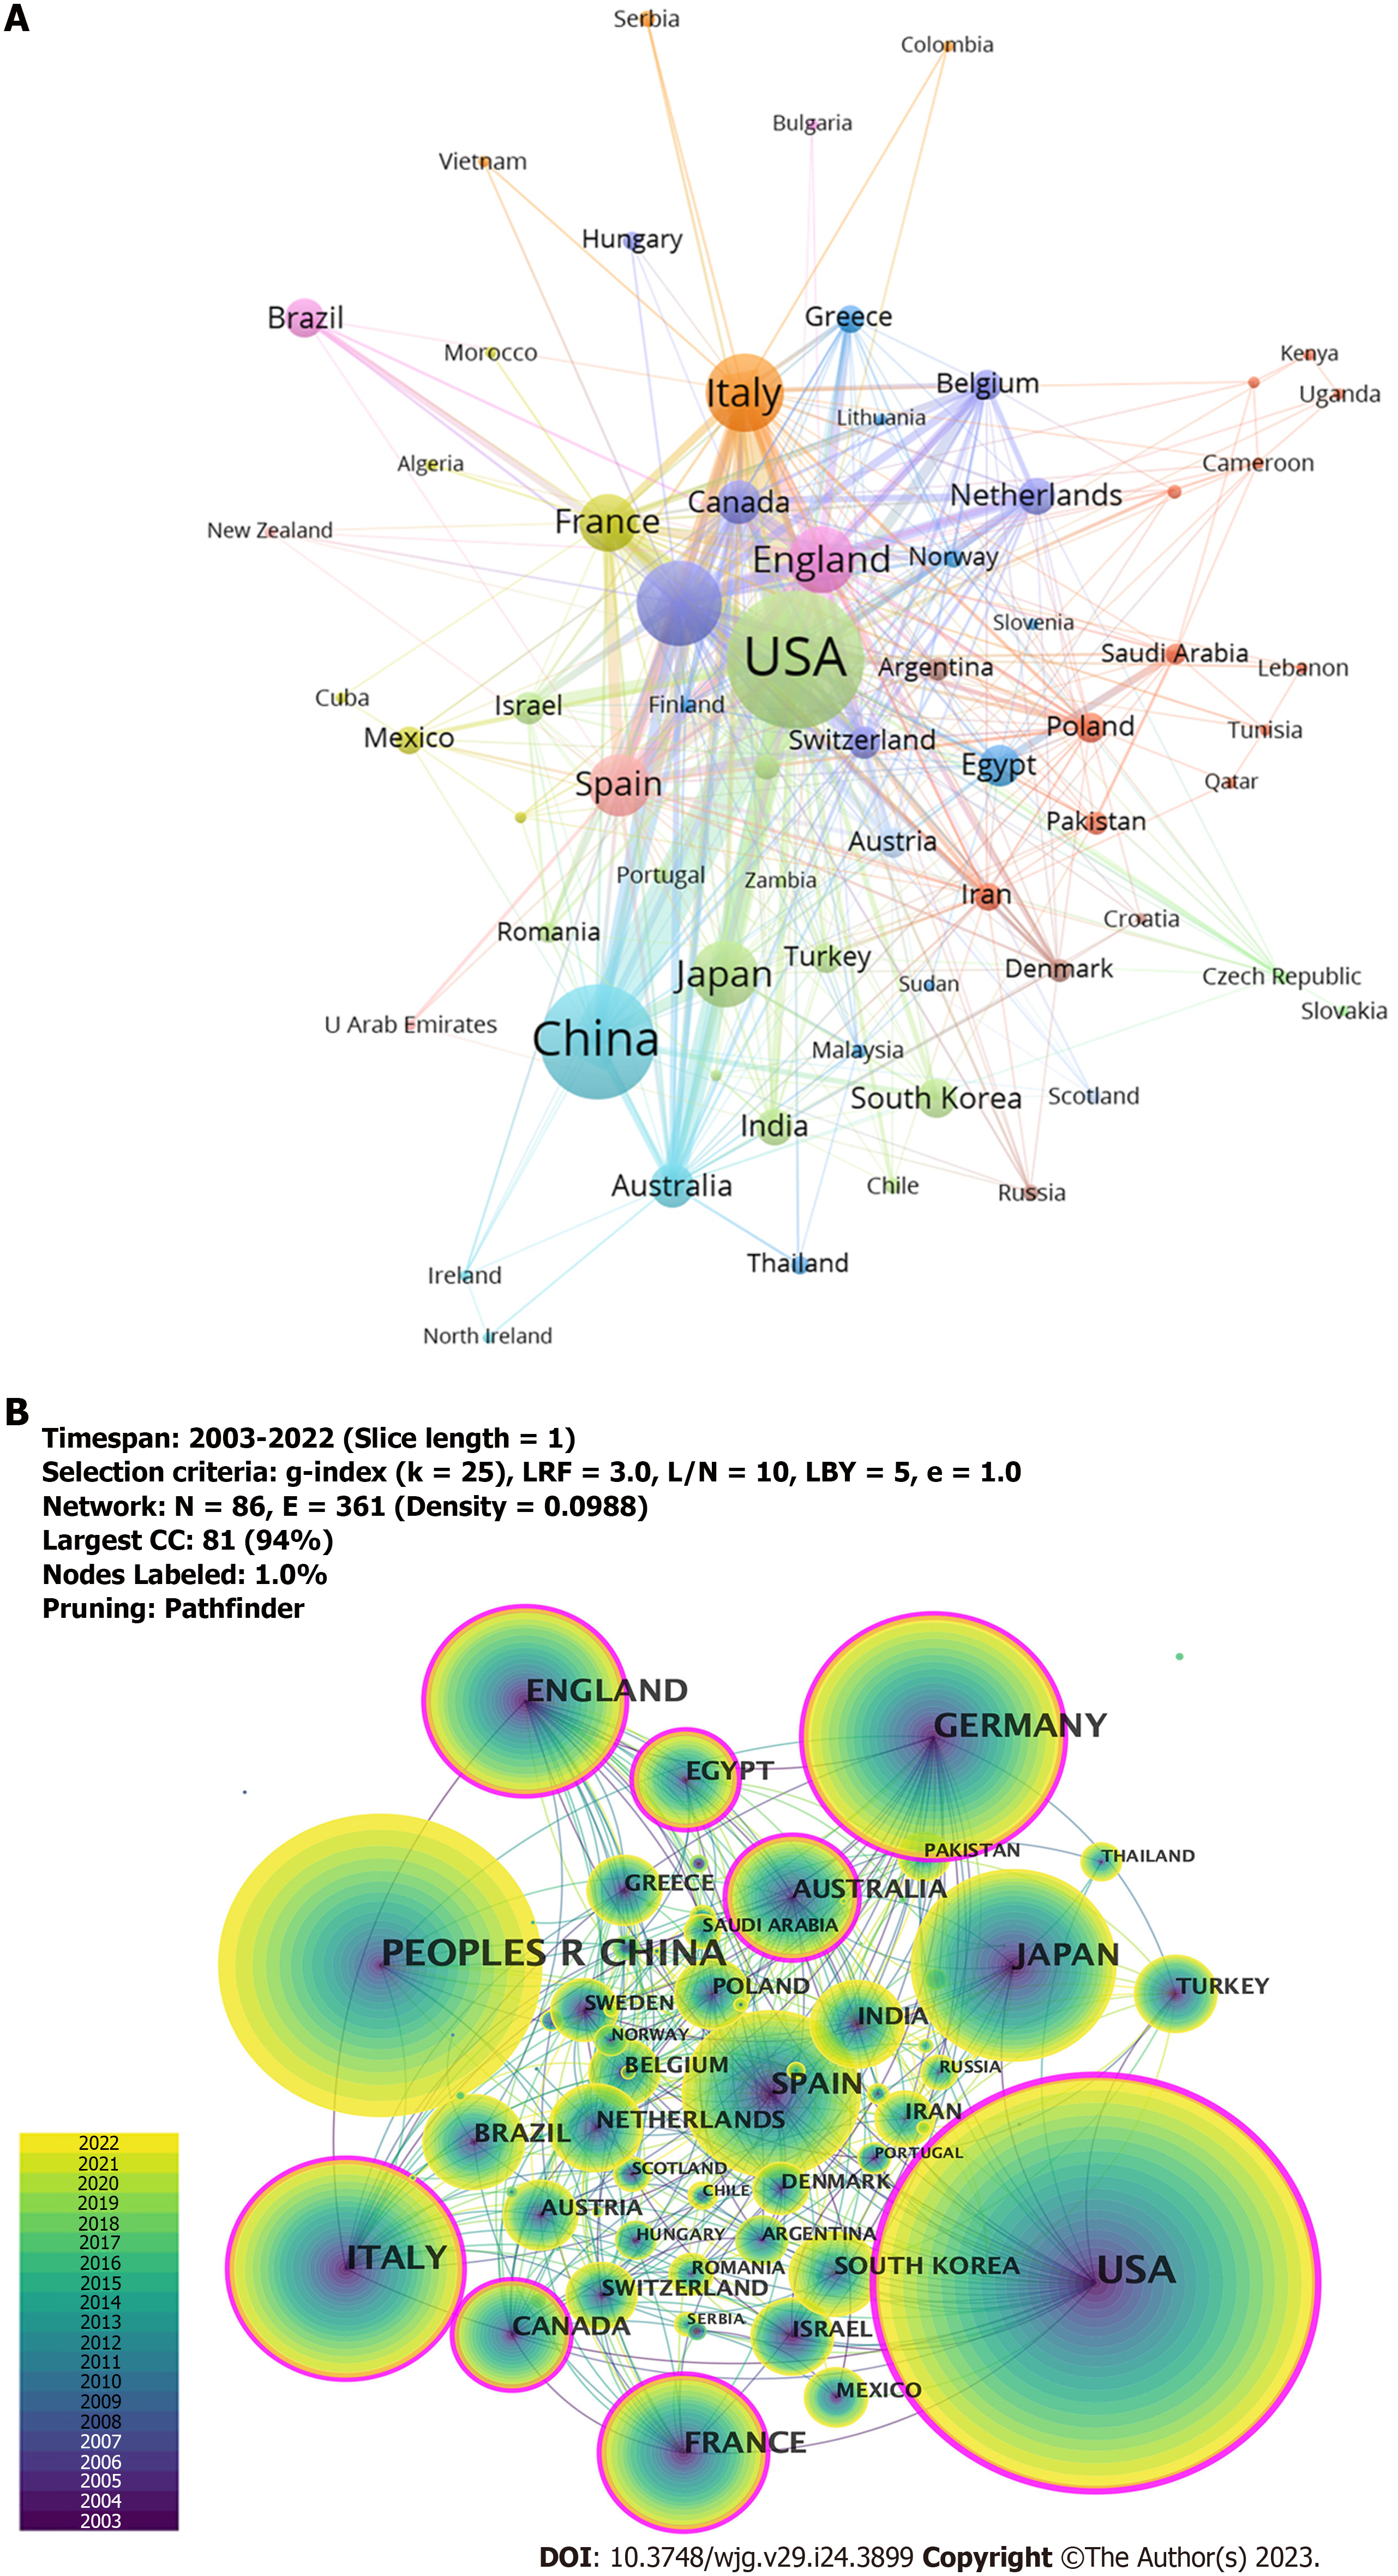
Figure 3 Cooperation map of countries/regions in immunological factors in cirrhosis.
A: A visual map for VOSviewer network; B: A visual map for CiteSpace network. The size of the node reflects the frequencies, and the links indicate the collaboration relationships. The outermost purple ring represents the centrality level, and the nodes with high centrality are considered to be the key points in the research field.
- Citation: Zhang D, Liu BW, Liang XQ, Liu FQ. Immunological factors in cirrhosis diseases from a bibliometric point of view. World J Gastroenterol 2023; 29(24): 3899-3921
- URL: https://www.wjgnet.com/1007-9327/full/v29/i24/3899.htm
- DOI: https://dx.doi.org/10.3748/wjg.v29.i24.3899


