Copyright
©The Author(s) 2023.
World J Gastroenterol. Jun 28, 2023; 29(24): 3793-3806
Published online Jun 28, 2023. doi: 10.3748/wjg.v29.i24.3793
Published online Jun 28, 2023. doi: 10.3748/wjg.v29.i24.3793
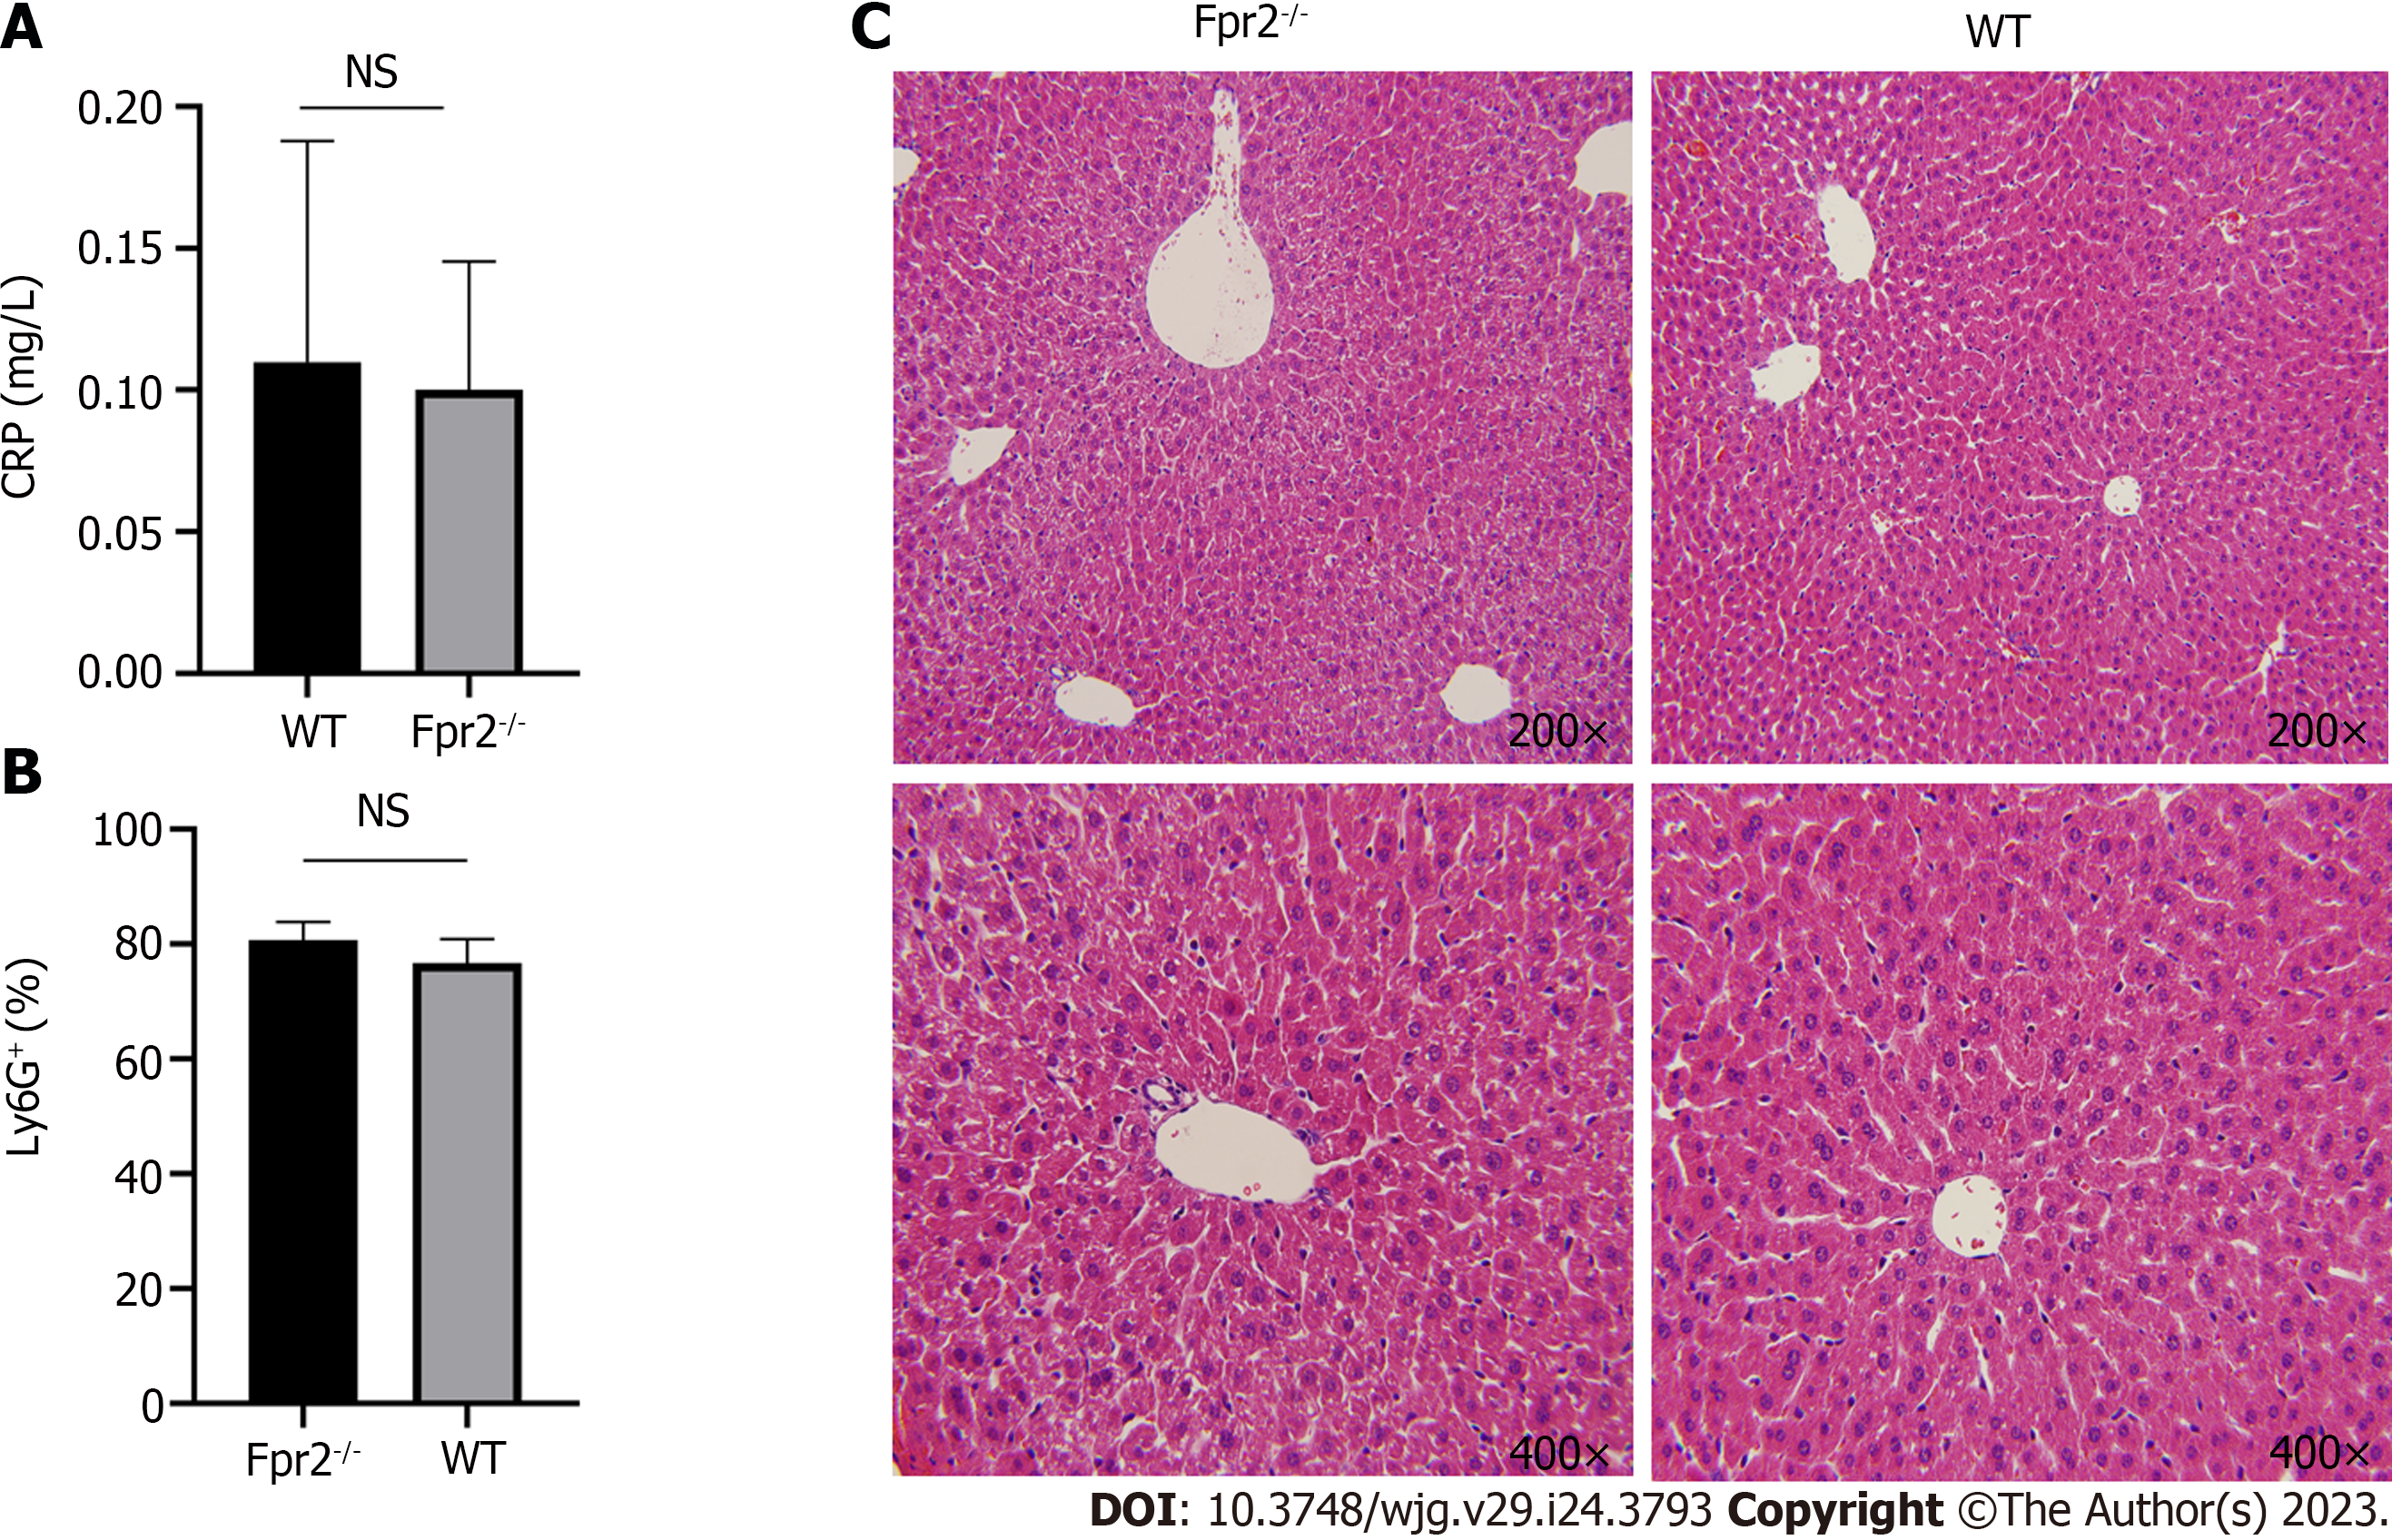
Figure 7 Evaluation of liver inflammation status.
A: Serum C-reactive protein level in wild-type (WT) and formyl peptide receptor 2 (Fpr2)-/- mice (n = 4); B: Flow cytometry analysis of the number of neutrophils (% of Ly6G+ cells) in the liver of WT and Fpr2-/- mice (n = 3); C: Representative images of hematoxylin-eosin staining of liver tissue sections of Fpr2-/- and WT mice. The image magnification is 200 × and 400 ×. NS: No significant difference. Fpr2: Formyl peptide receptor 2; WT: Wild-type; CRP: C-reactive protein.
- Citation: Liu H, Sun ZY, Jiang H, Li XD, Jiang YQ, Liu P, Huang WH, Lv QY, Zhang XL, Li RK. Transcriptome sequencing and experiments reveal the effect of formyl peptide receptor 2 on liver homeostasis. World J Gastroenterol 2023; 29(24): 3793-3806
- URL: https://www.wjgnet.com/1007-9327/full/v29/i24/3793.htm
- DOI: https://dx.doi.org/10.3748/wjg.v29.i24.3793


