Copyright
©The Author(s) 2022.
World J Gastroenterol. Dec 21, 2022; 28(47): 6769-6787
Published online Dec 21, 2022. doi: 10.3748/wjg.v28.i47.6769
Published online Dec 21, 2022. doi: 10.3748/wjg.v28.i47.6769
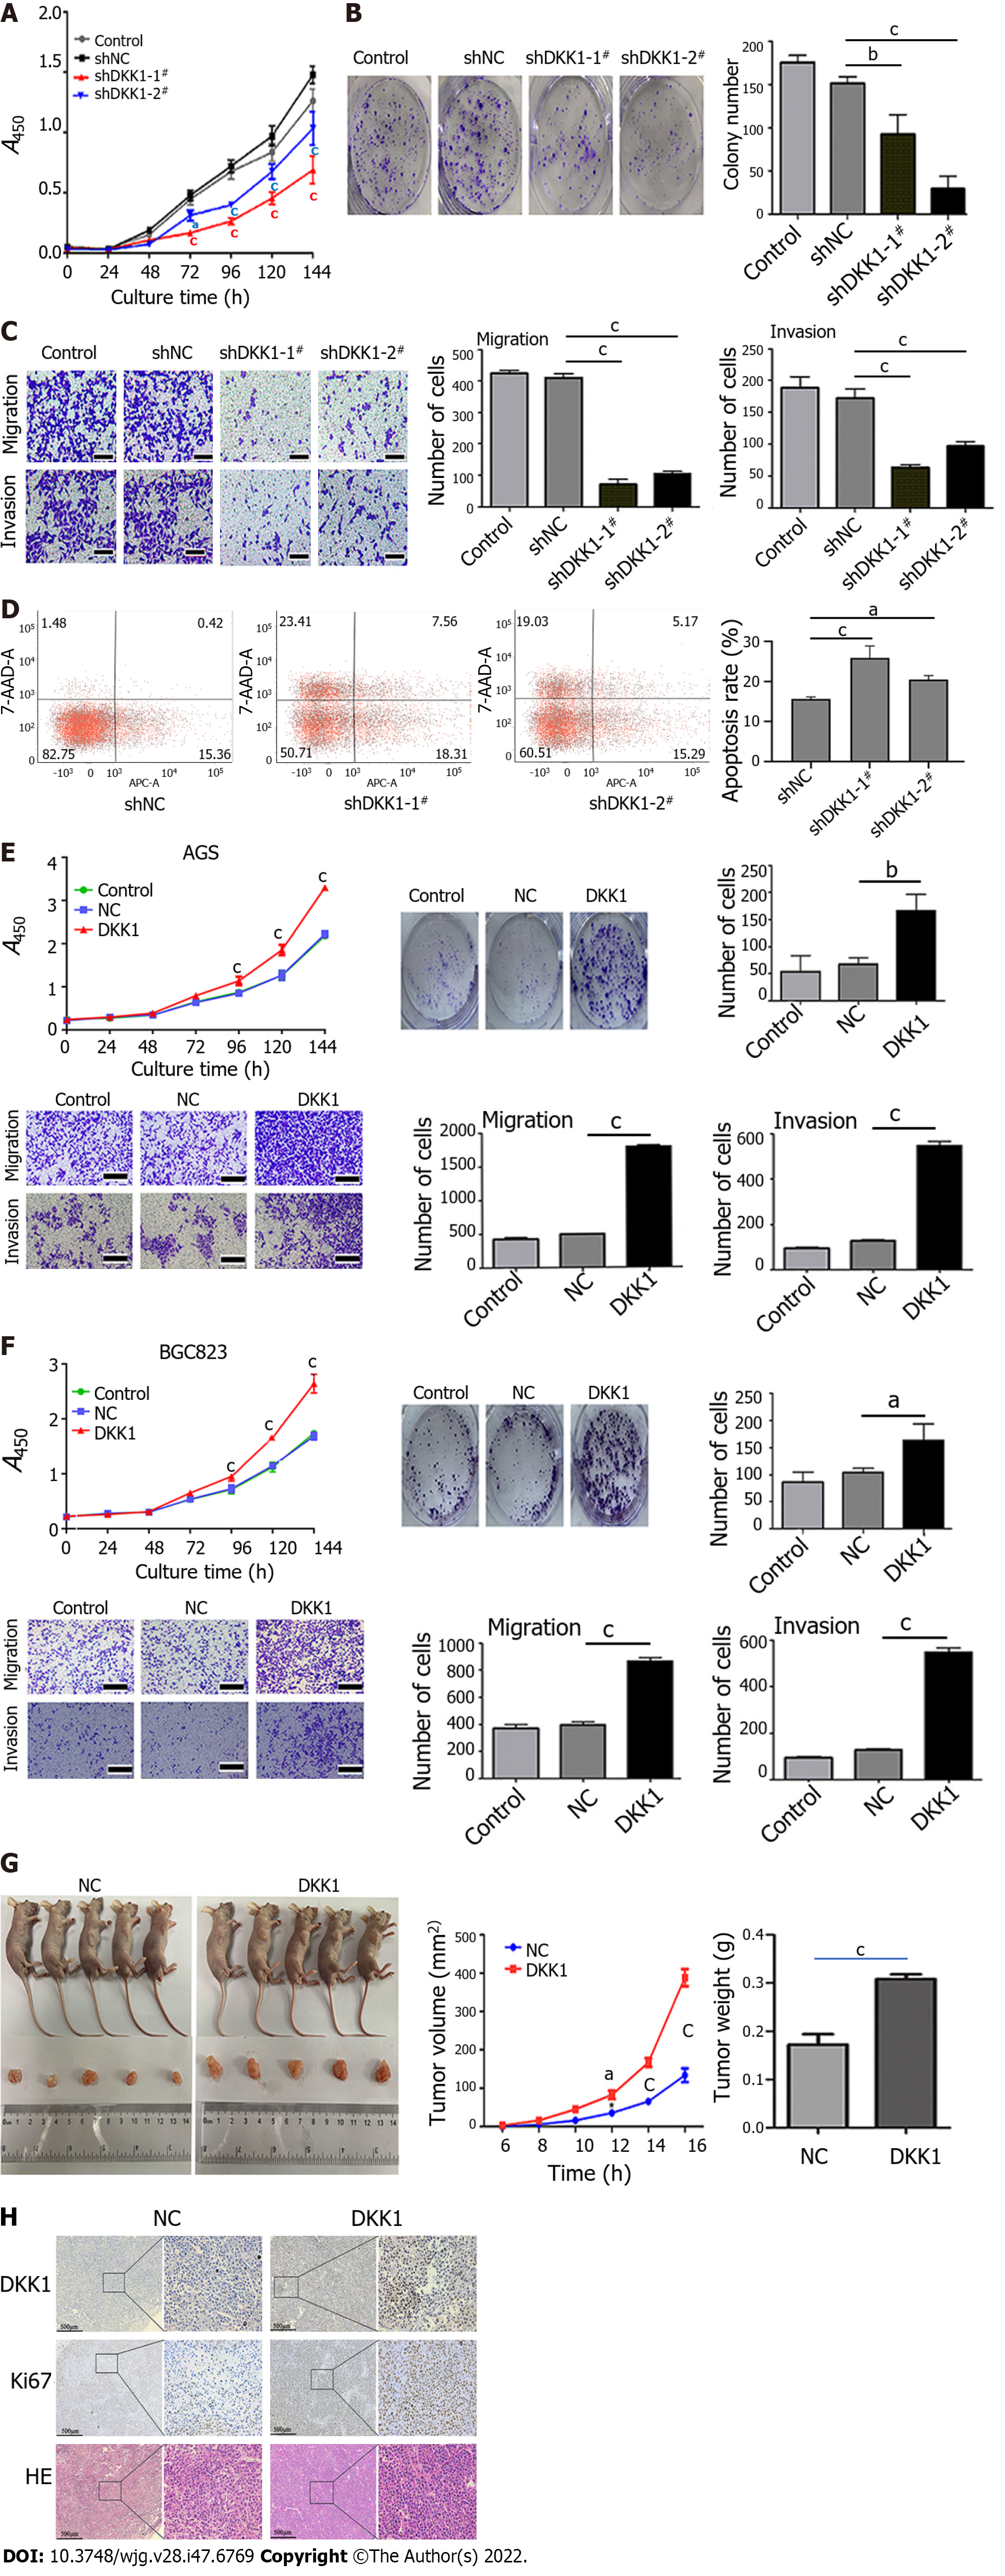
Figure 4 The effects of dickkopf-related protein 1 knockdown and overexpression on gastric cancer cell growth, migration, invasion, apoptosis, and xenograft growth in nude mice.
A: Growth curve of dickkopf-related protein 1 (DKK1) knockdown AGS cells using CCK8 assay. aP < 0.05; cP < 0.001; B: Colony formation assay of AGS cells with DKK1 knockdown. bP < 0.01; cP < 0.001; C: Migration and invasion assay of DKK1 knockdown AGS cells using Transwell system. Bar graphs show the number of migrated or invaded cells (right). cP < 0.001. Scale bar = 200 μm; D: Flow cytometry analysis for apoptosis in DKK1 knockdown AGS cells. Bar graphs show the percentage of apoptotic cells (right). aP < 0.05; cP < 0.001; E and F: CCK8, colony formation, and Transwell assays were used to measure the growth curve, colony formation, migration, and invasion of AGS (E) and BGC823 (F) cells with DKK1 overexpression. aP < 0.05; bP < 0.01; cP < 0.001; Scale bar = 200 μm; G: DKK1 overexpression promotes xenograft tumor growth in nude mice. Line dot and bar graph show tumor volume and weight, respectively (n = 5 mice per group). aP < 0.05; cP < 0.001; H: Hematoxylin eosin staining of xenograft tumors and immunohistochemical analysis of DKK1 and Ki67 in xenograft tumors from nude mice. The boxed regions are magnified to the right. Scale bar = 500 μm. DKK1: Dickkopf-related protein 1; HE: Hematoxylin eosin.
- Citation: Luo M, Chen YJ, Xie Y, Wang QR, Xiang YN, Long NY, Yang WX, Zhao Y, Zhou JJ. Dickkopf-related protein 1/cytoskeleton-associated protein 4 signaling activation by Helicobacter pylori-induced activator protein-1 promotes gastric tumorigenesis via the PI3K/AKT/mTOR pathway. World J Gastroenterol 2022; 28(47): 6769-6787
- URL: https://www.wjgnet.com/1007-9327/full/v28/i47/6769.htm
- DOI: https://dx.doi.org/10.3748/wjg.v28.i47.6769


