Copyright
©The Author(s) 2022.
World J Gastroenterol. Dec 7, 2022; 28(45): 6421-6432
Published online Dec 7, 2022. doi: 10.3748/wjg.v28.i45.6421
Published online Dec 7, 2022. doi: 10.3748/wjg.v28.i45.6421
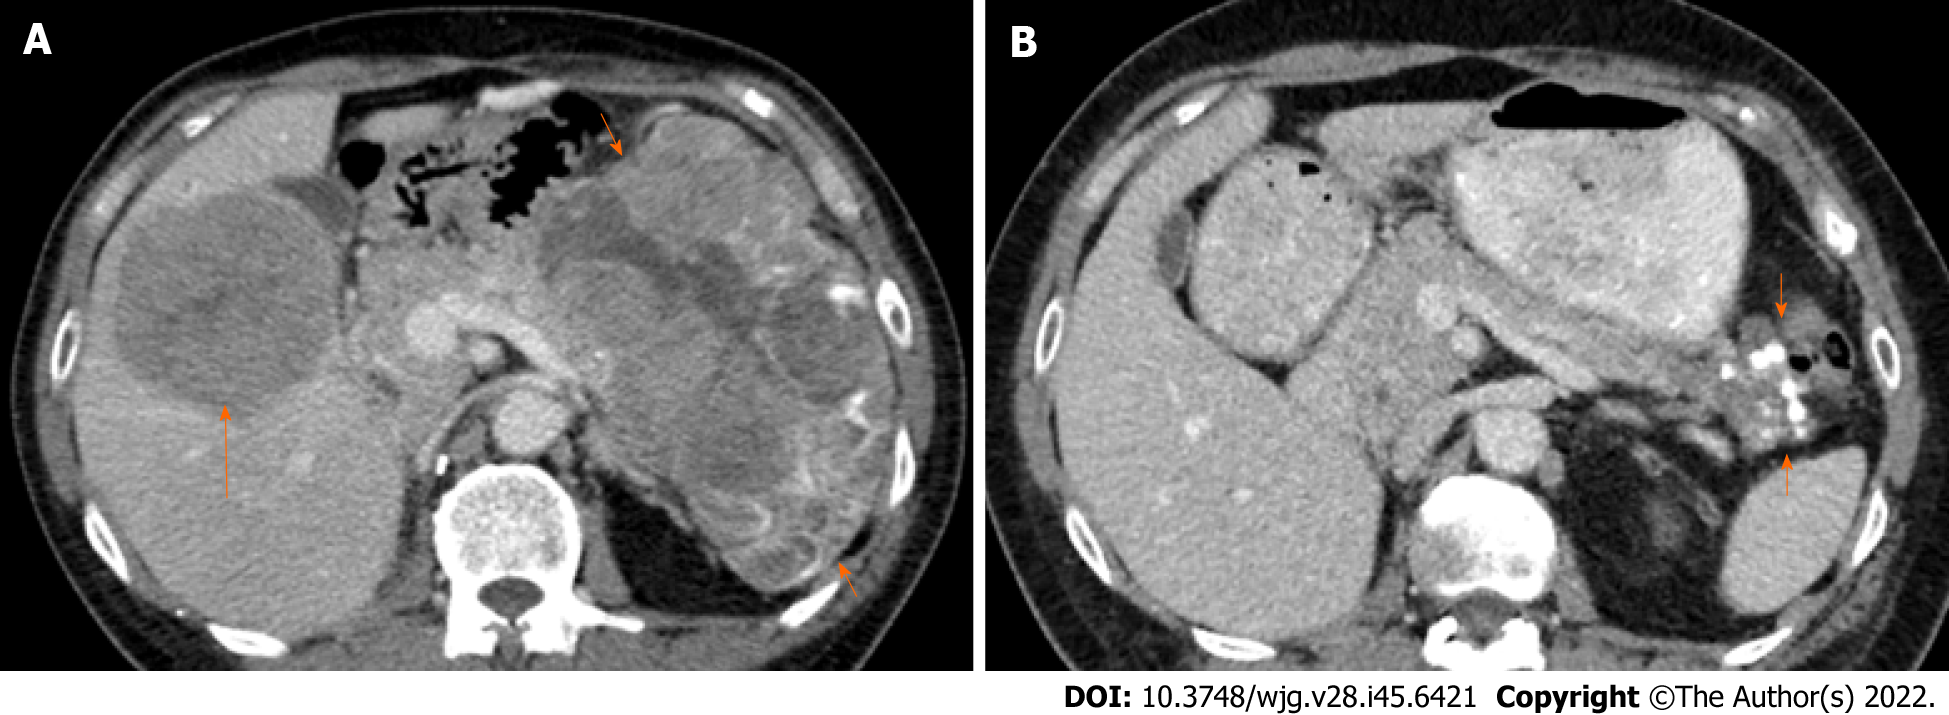
Figure 2 Comparison of serial computed tomography images of our patient during chemotherapy.
A: Initial axial post-contrast computed tomography (CT) scan shows a large heterogeneous solid mass in the pancreatic tail (short arrows) and a hypoattenuating metastatic liver mass (long arrow); B: Post-chemotherapy axial CT scan performed after 11 cycles of chemotherapy demonstrates marked interval reduction in the size of the pancreatic mass (arrows) and metastatic liver mass (not visible in this image).
- Citation: Lee CL, Holter S, Borgida A, Dodd A, Ramotar S, Grant R, Wasson K, Elimova E, Jang RW, Moore M, Kim TK, Khalili K, Moulton CA, Gallinger S, O’Kane GM, Knox JJ. Germline BRCA2 variants in advanced pancreatic acinar cell carcinoma: A case report and review of literature. World J Gastroenterol 2022; 28(45): 6421-6432
- URL: https://www.wjgnet.com/1007-9327/full/v28/i45/6421.htm
- DOI: https://dx.doi.org/10.3748/wjg.v28.i45.6421


