Copyright
©The Author(s) 2022.
World J Gastroenterol. Sep 28, 2022; 28(36): 5364-5379
Published online Sep 28, 2022. doi: 10.3748/wjg.v28.i36.5364
Published online Sep 28, 2022. doi: 10.3748/wjg.v28.i36.5364
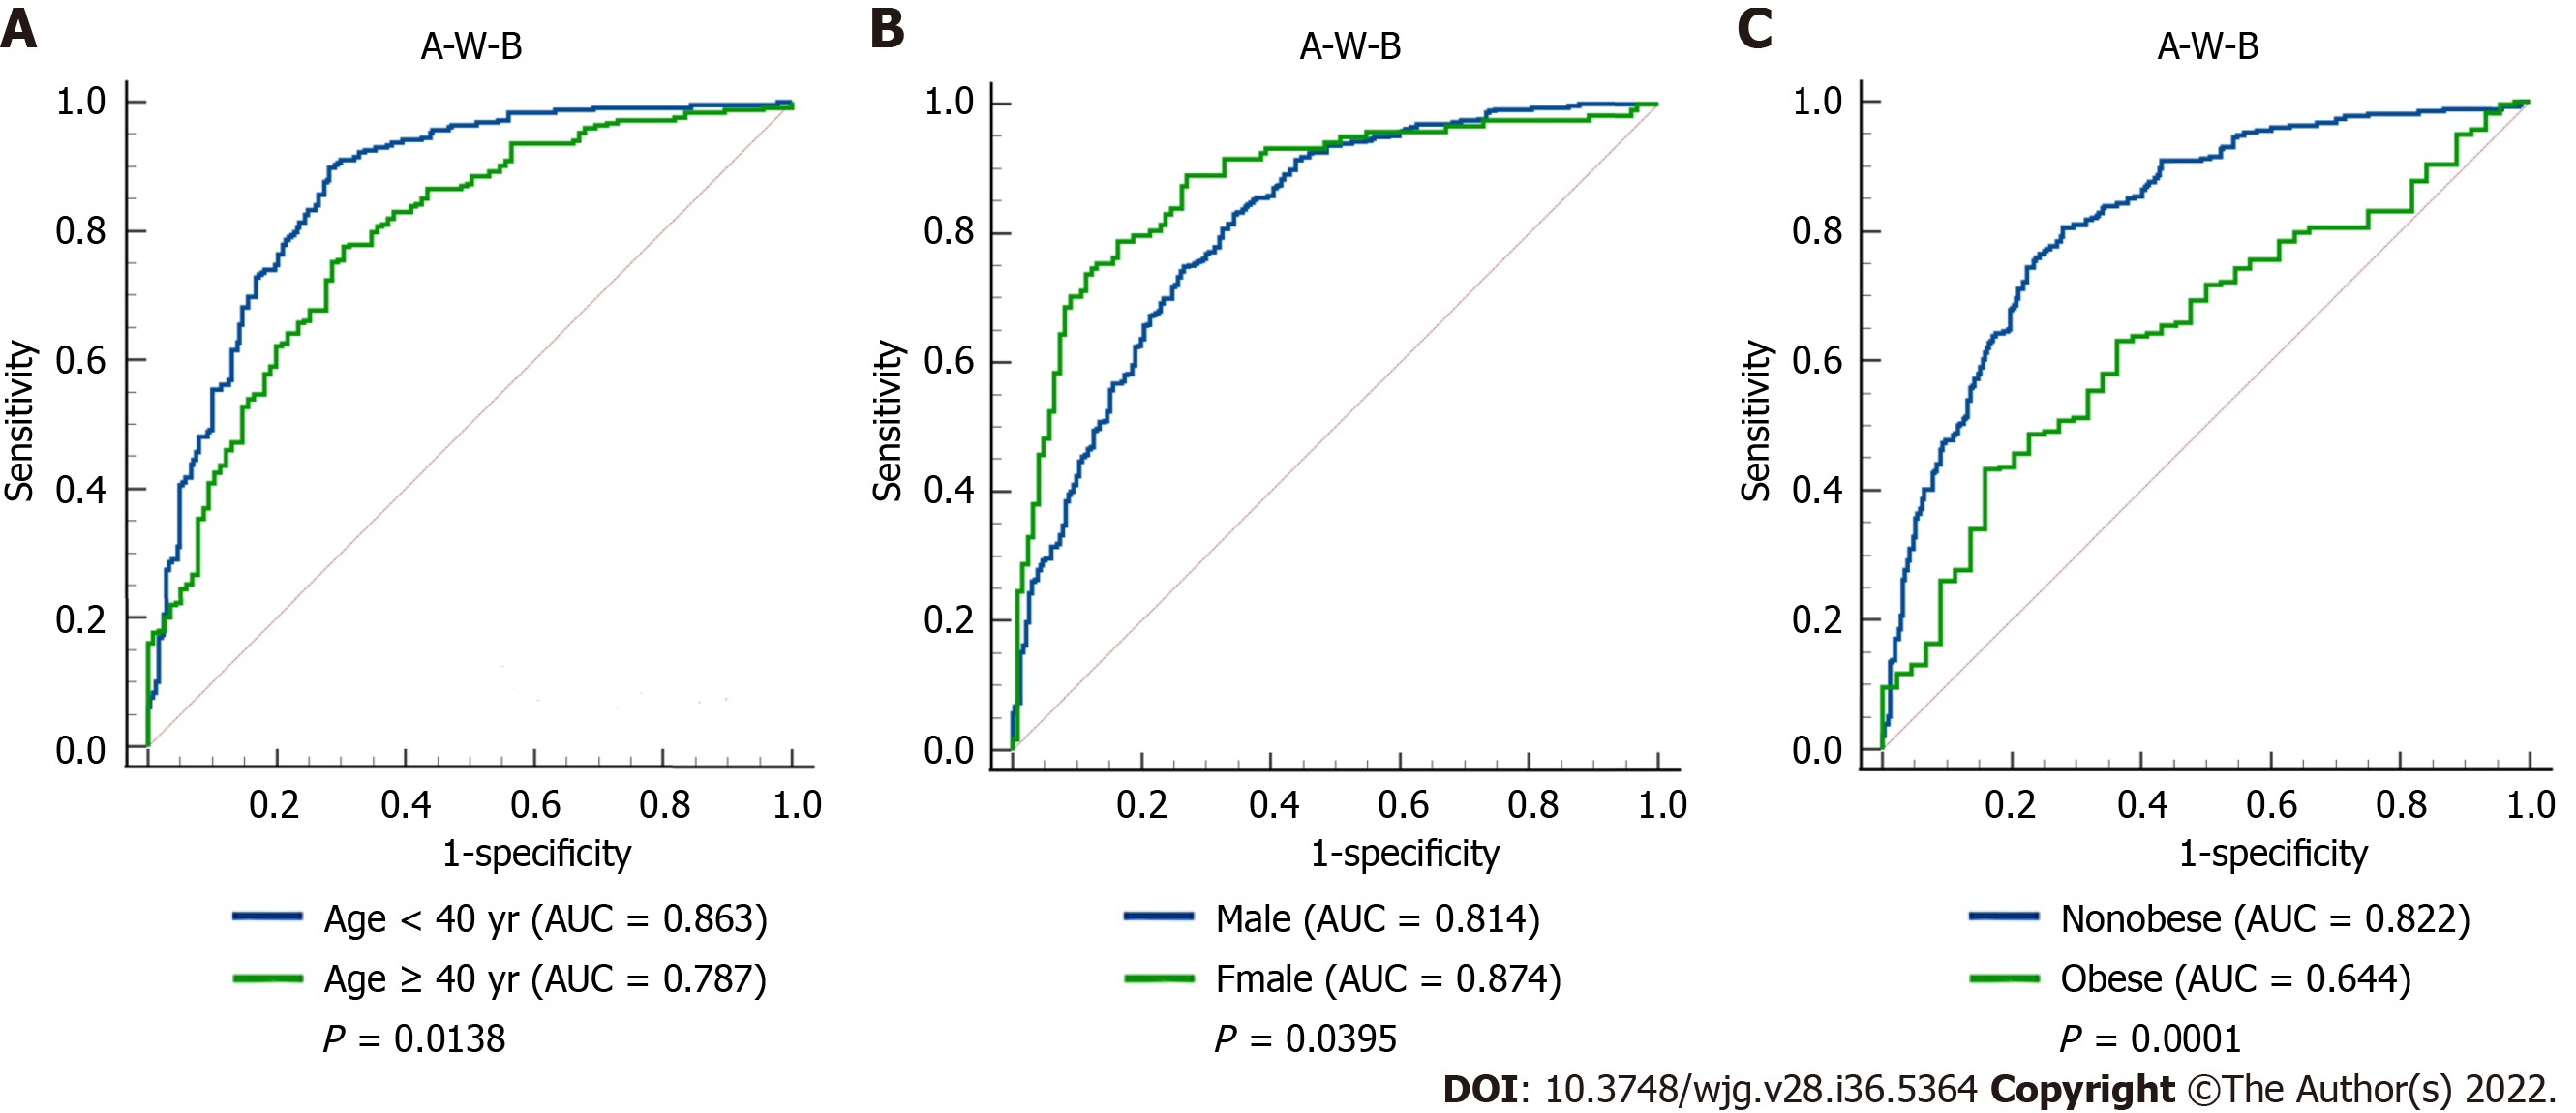
Figure 4 Receiver operating characteristic curves of the A-W-B model to predict metabolic-associated fatty liver disease in different subgroups.
A: Comparison between young (age < 40 years) and middle-age and elderly (age ≥ 40 years) subjects (P = 0.0138); B: Comparison between male and female subjects (P = 0.0395); C: Comparison between nonobese and obese subjects (P = 0.0001); AUC: Area under the receiver operating characteristic curve; A-W-B: Prediction model combining atherogenic index of plasma, waist circumference, and body mass index.
- Citation: Duan SJ, Ren ZY, Zheng T, Peng HY, Niu ZH, Xia H, Chen JL, Zhou YC, Wang RR, Yao SK. Atherogenic index of plasma combined with waist circumference and body mass index to predict metabolic-associated fatty liver disease. World J Gastroenterol 2022; 28(36): 5364-5379
- URL: https://www.wjgnet.com/1007-9327/full/v28/i36/5364.htm
- DOI: https://dx.doi.org/10.3748/wjg.v28.i36.5364


