Copyright
©The Author(s) 2022.
World J Gastroenterol. Sep 28, 2022; 28(36): 5364-5379
Published online Sep 28, 2022. doi: 10.3748/wjg.v28.i36.5364
Published online Sep 28, 2022. doi: 10.3748/wjg.v28.i36.5364
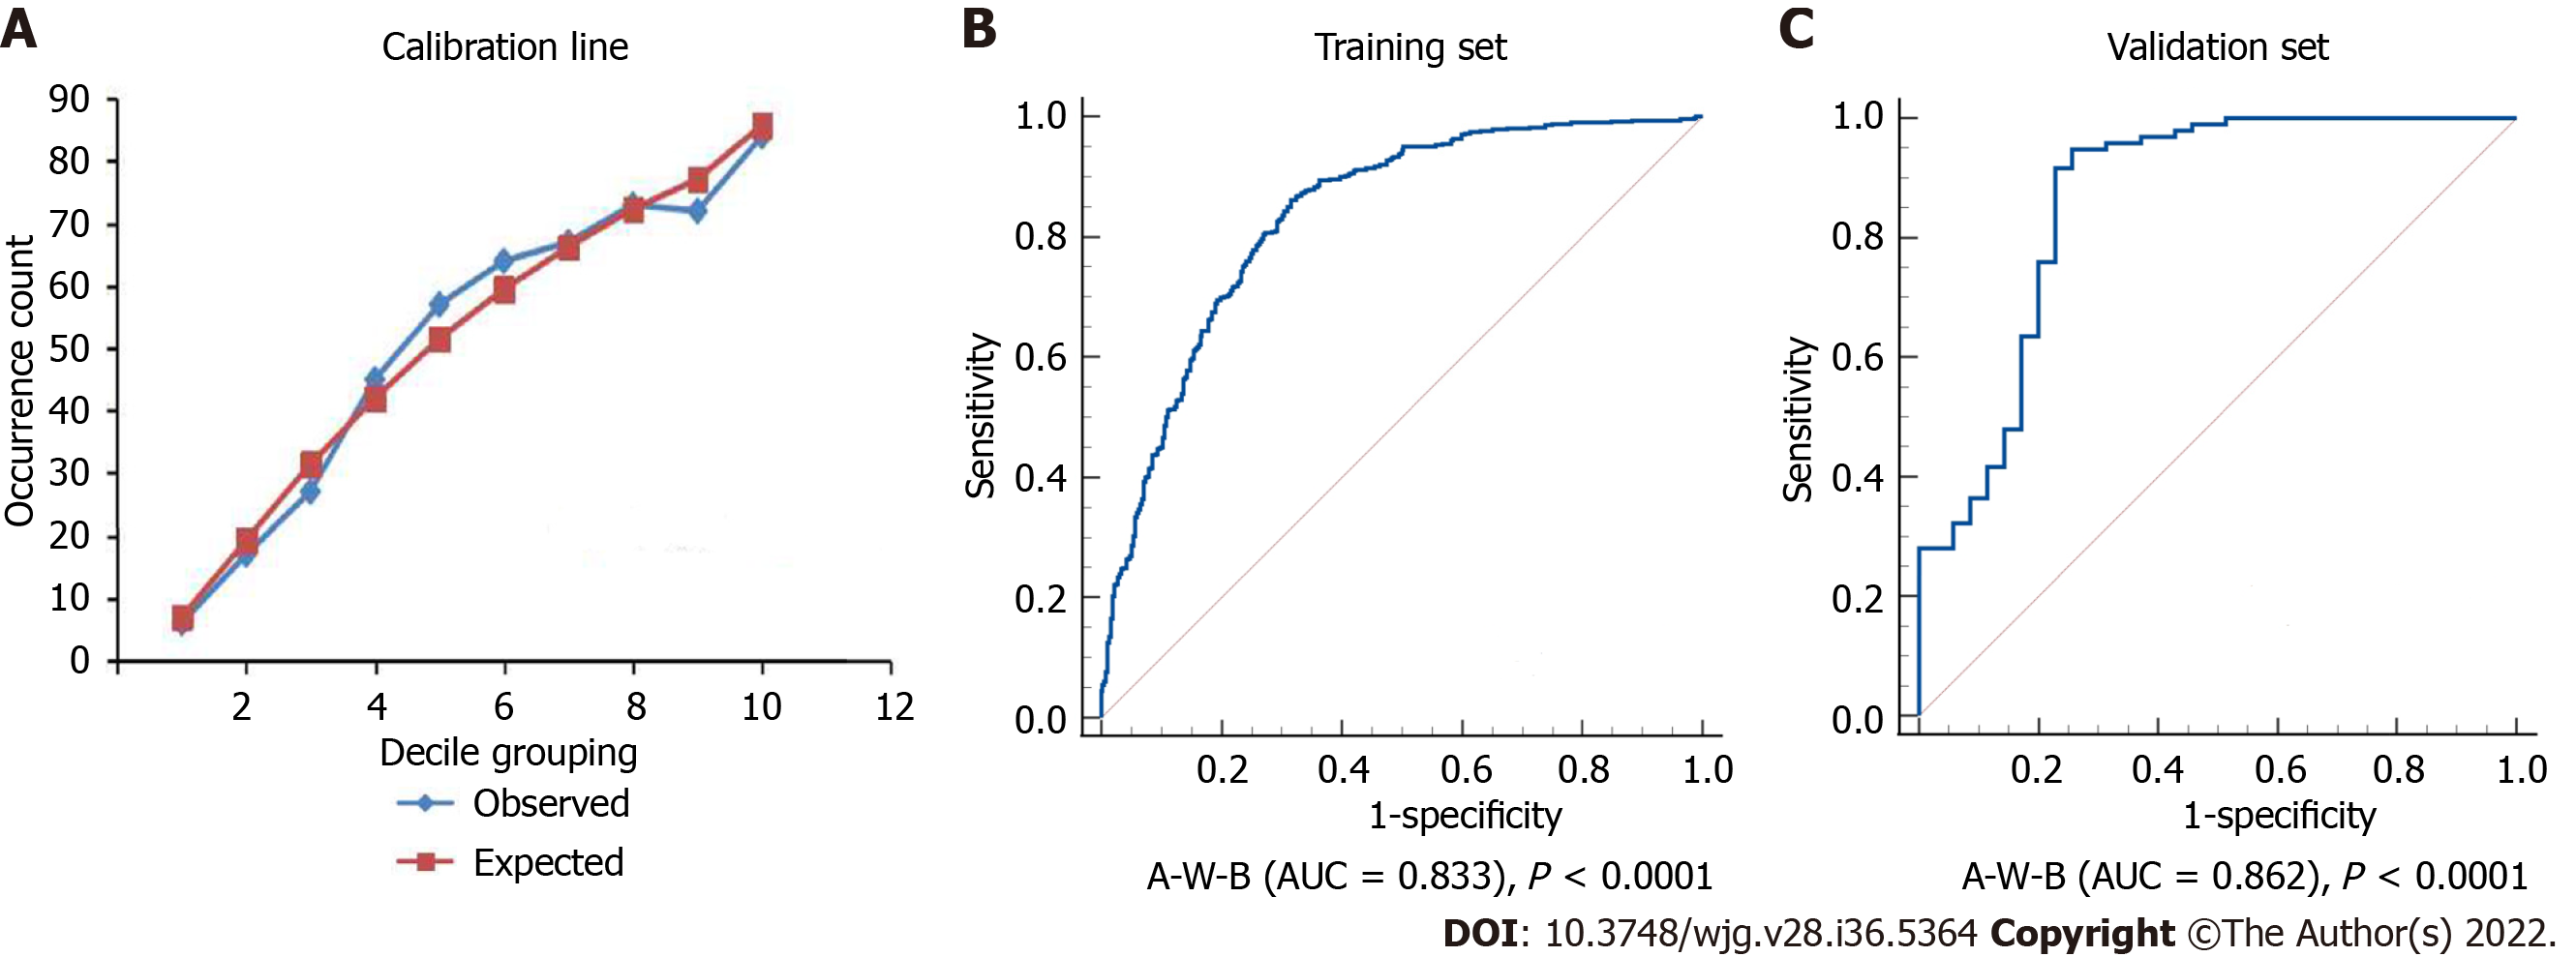
Figure 3 Calibration line and receiver operating characteristic curves of the A-W-B model.
A: Calibration line of the prediction model combining atherogenic index of plasma, waist circumference, and body mass index (A-W-B) model (Hosmer-Lemeshow test: χ2 = 8.5901, P = 0.3780); B: Receiver operating characteristic curve of the A-W-B model in the training set (area under the receiver operating characteristic curve [AUC] = 0.833); C: Receiver operating characteristic curve of the A-W-B model in the validation set (AUC = 0.862).
- Citation: Duan SJ, Ren ZY, Zheng T, Peng HY, Niu ZH, Xia H, Chen JL, Zhou YC, Wang RR, Yao SK. Atherogenic index of plasma combined with waist circumference and body mass index to predict metabolic-associated fatty liver disease. World J Gastroenterol 2022; 28(36): 5364-5379
- URL: https://www.wjgnet.com/1007-9327/full/v28/i36/5364.htm
- DOI: https://dx.doi.org/10.3748/wjg.v28.i36.5364


