Copyright
©The Author(s) 2022.
World J Gastroenterol. Sep 21, 2022; 28(35): 5154-5174
Published online Sep 21, 2022. doi: 10.3748/wjg.v28.i35.5154
Published online Sep 21, 2022. doi: 10.3748/wjg.v28.i35.5154
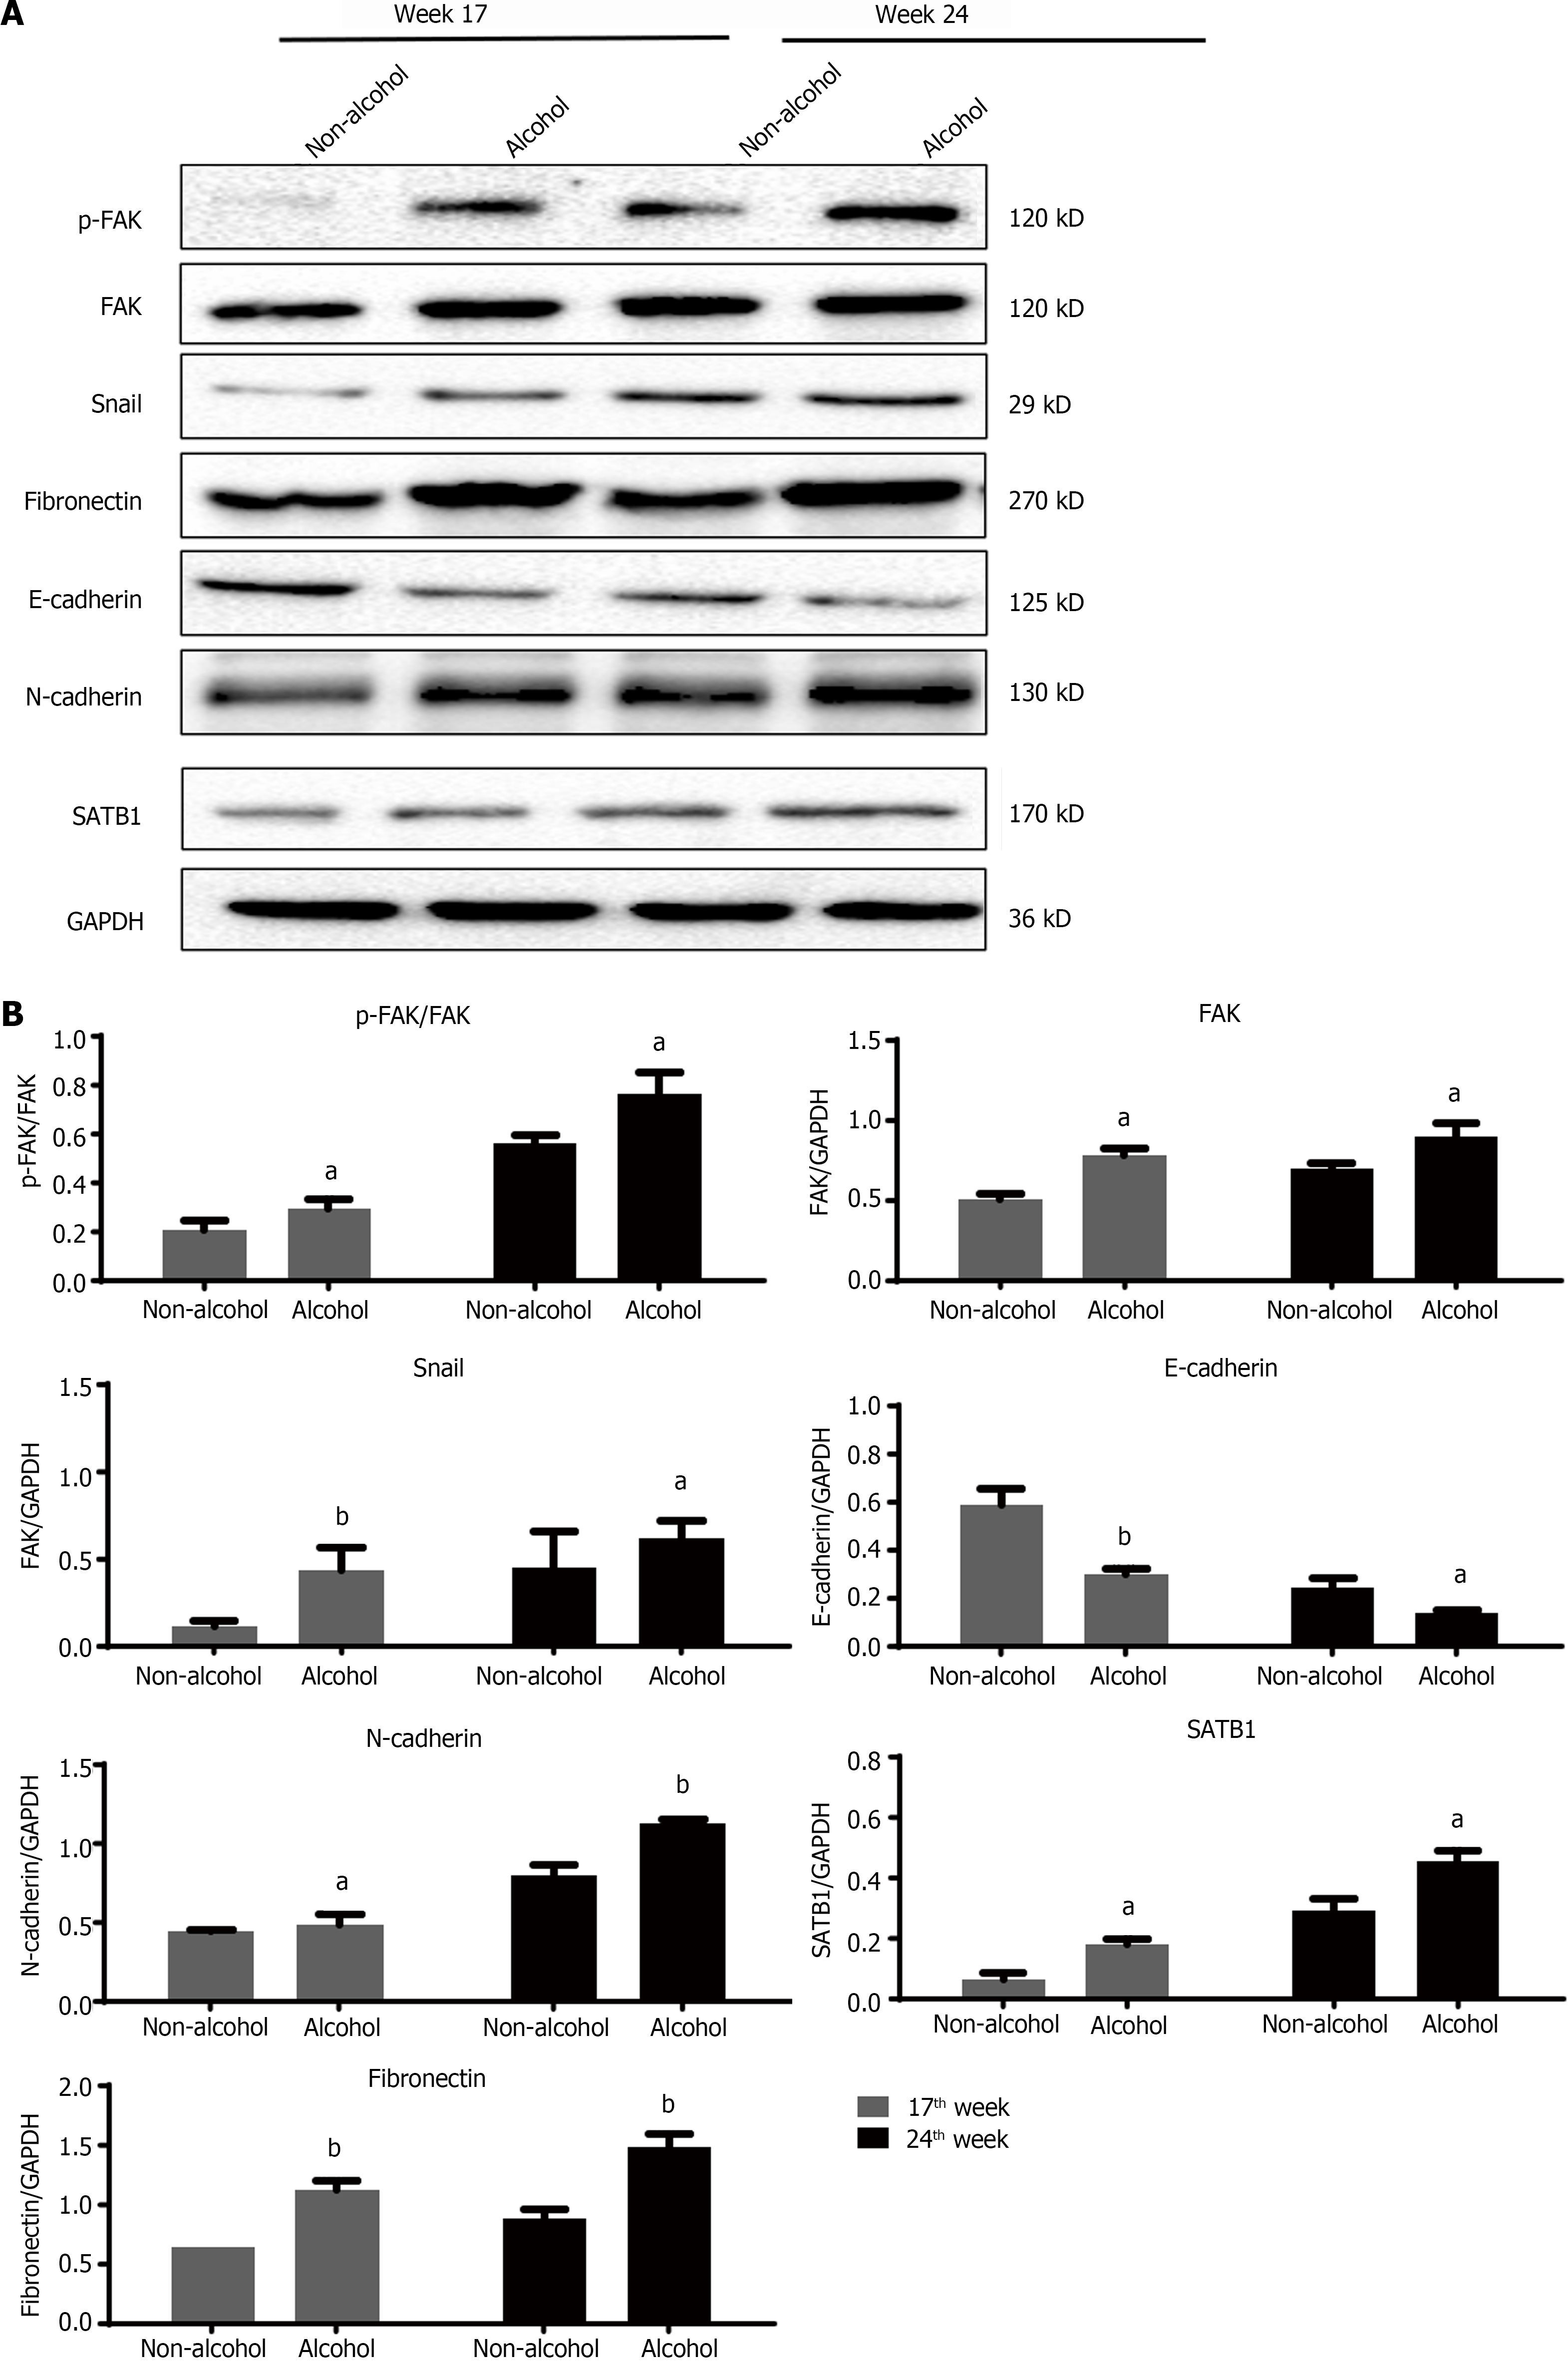
Figure 4 Quantification of the protein levels of epithelial mesenchymal transformation-related markers in colorectal cancer rats by using western blotting.
The bars represent the mean ± SD (n = 3). A: The western blotting images of phosphorylate-focal adhesion kinase (p-FAK), FAK, snail, fibronectin, E-cadherin, N-cadherin and special AT-rich sequence binding protein 1 (SATB1) in animal samples; B: Quantification of the protein levels of FAK, p-FAK/FAK, snail, fibronectin, E-cadherin, N-cadherin and SATB1 in animal samples. Compared with the non-alcohol group: bP < 0.01, aP < 0.05. SATB1: Special AT-rich sequence binding protein 1; FAK: Focal adhesion kinase; p-FAK: Phosphorylate focal adhesion kinase; GAPDH: Glyceraldehyde-3-phosphate dehydrogenase.
- Citation: Nong FF, Liang YQ, Xing SP, Xiao YF, Chen HH, Wen B. Alcohol promotes epithelial mesenchymal transformation-mediated premetastatic niche formation of colorectal cancer by activating interaction between laminin-γ2 and integrin-β1. World J Gastroenterol 2022; 28(35): 5154-5174
- URL: https://www.wjgnet.com/1007-9327/full/v28/i35/5154.htm
- DOI: https://dx.doi.org/10.3748/wjg.v28.i35.5154


