Copyright
©The Author(s) 2022.
World J Gastroenterol. Sep 14, 2022; 28(34): 4973-4992
Published online Sep 14, 2022. doi: 10.3748/wjg.v28.i34.4973
Published online Sep 14, 2022. doi: 10.3748/wjg.v28.i34.4973
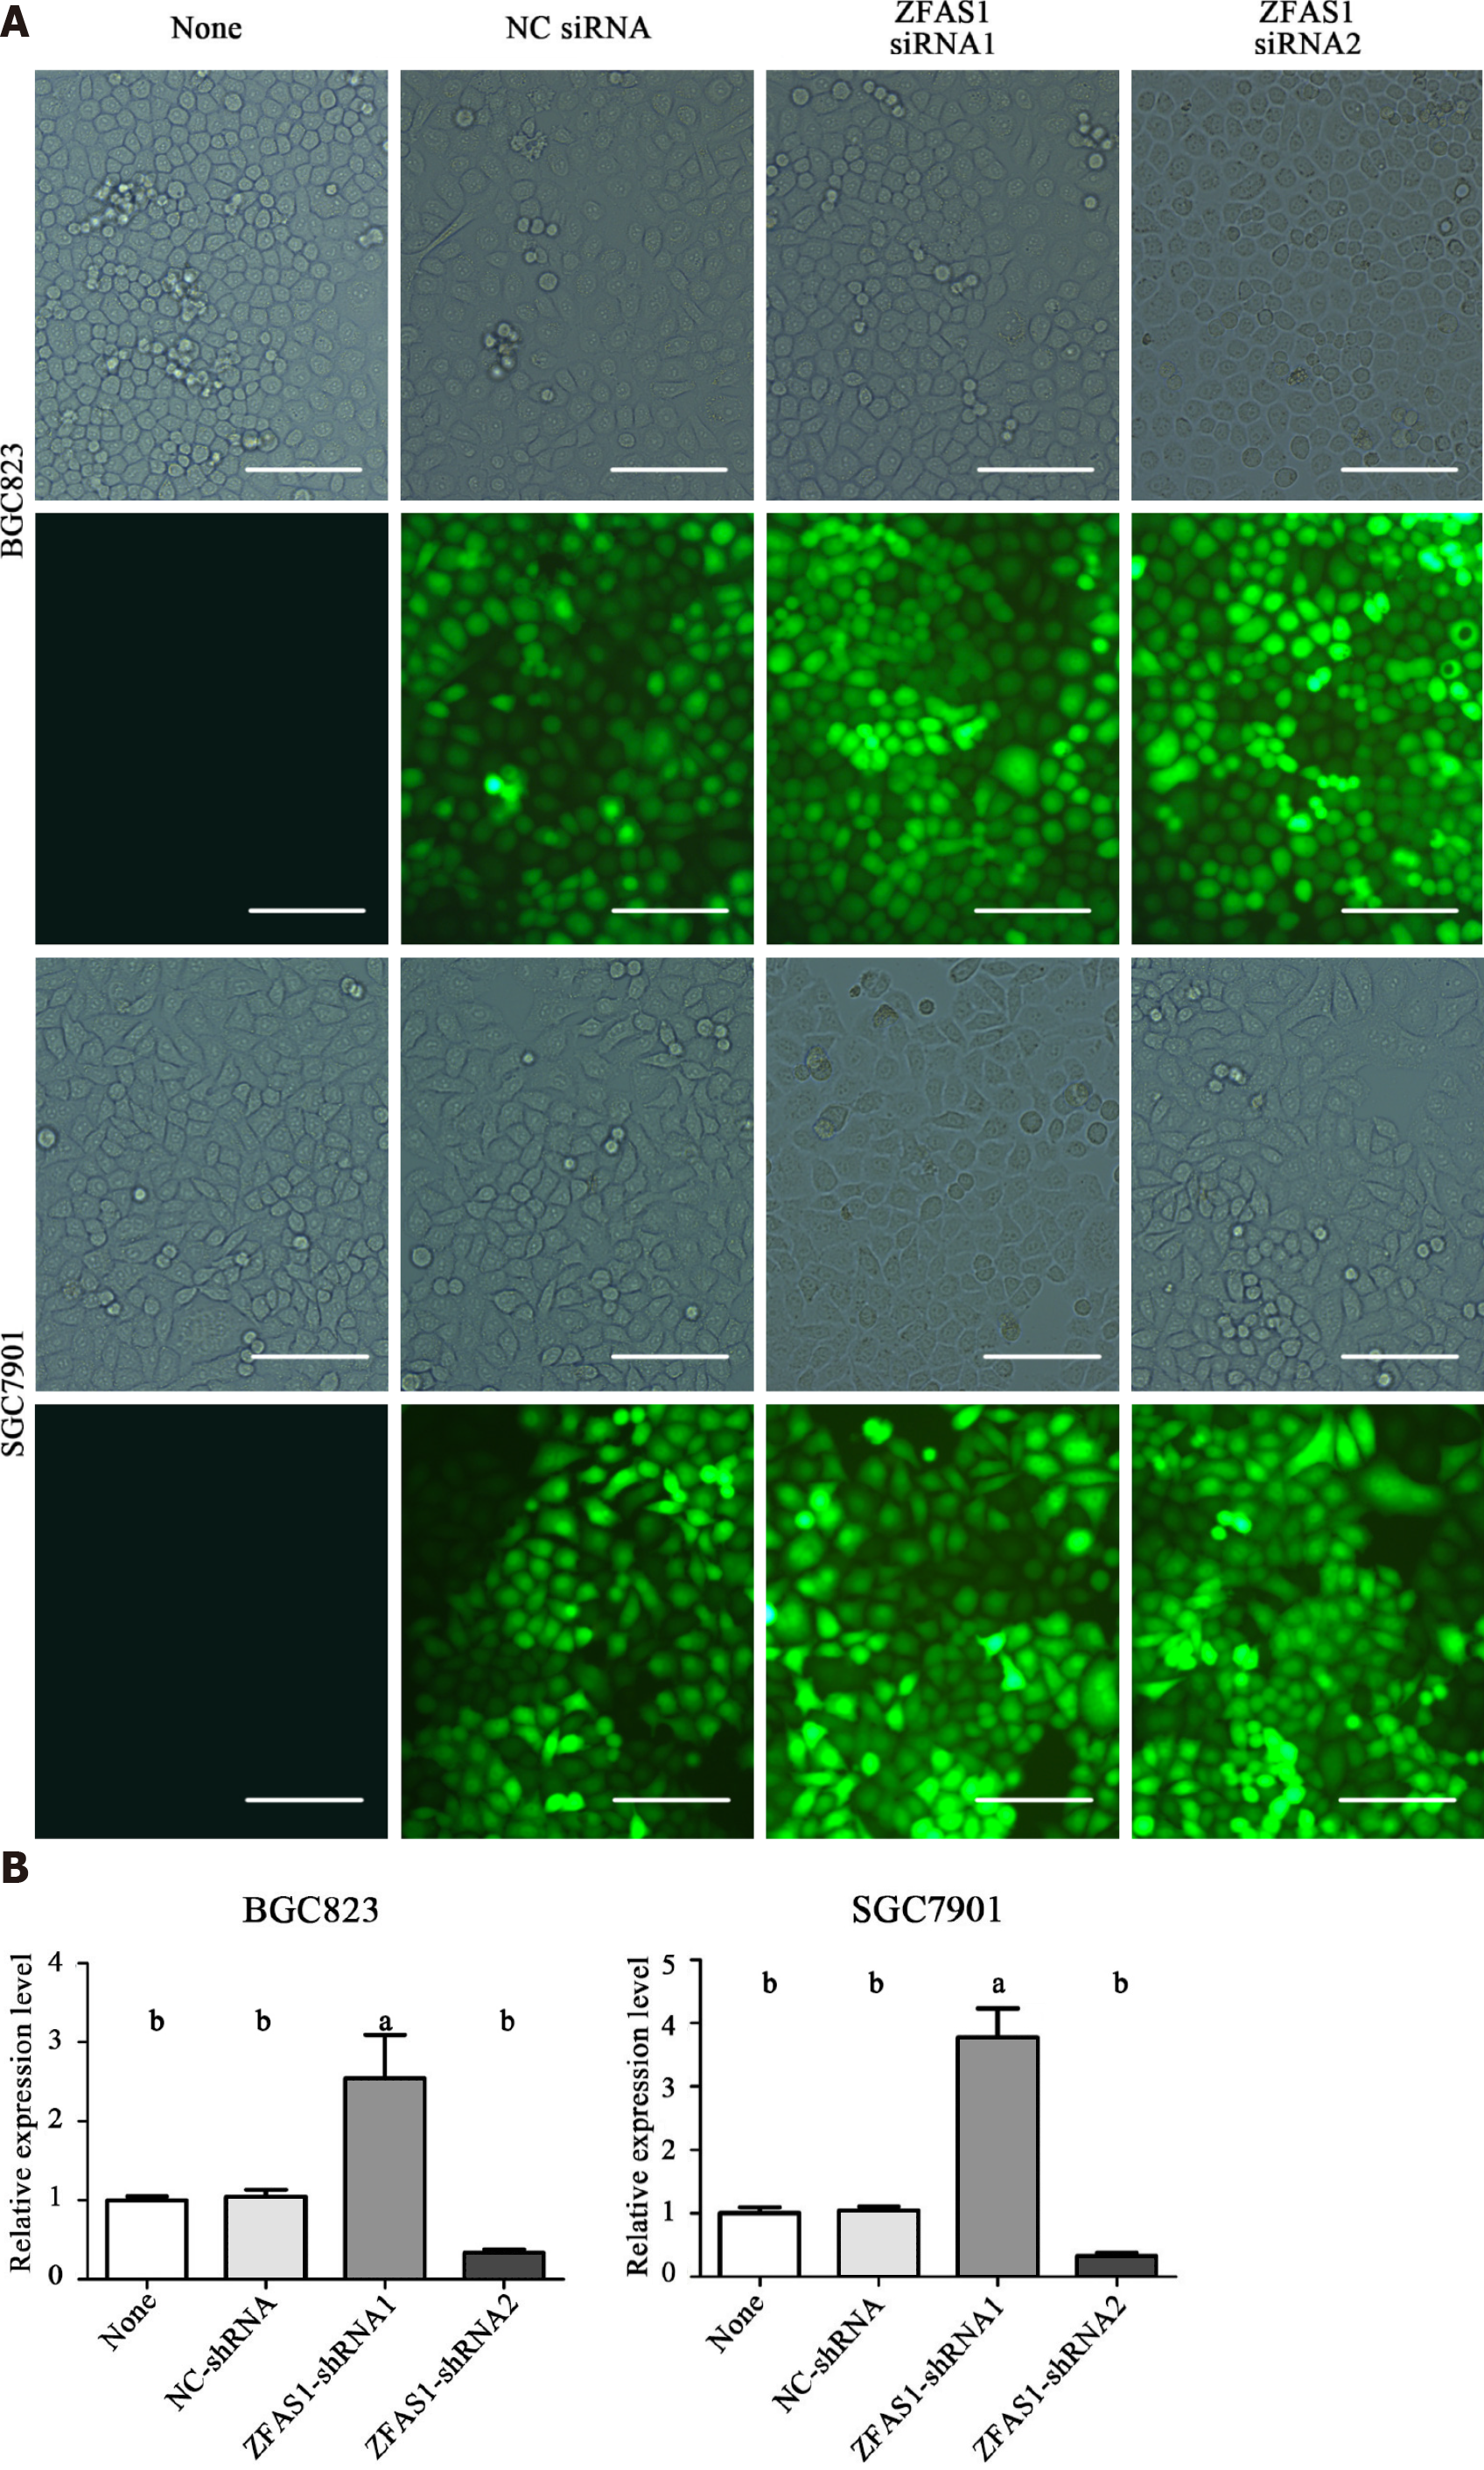
Figure 7 Fluorescence microscopy was used to test the transduction efficiency of ZNFX1-AS1-shRNA1 and ZNFX1-AS1-shRNA2.
A: The same position of BGC823 cells and SGC7901 cells under a normal microscope and fluorescence microscope, respectively; B: The relative expression of long noncoding RNA ZNFX1-AS1 (ZFAS1) in four groups of cells (None, NC-shRNA, ZFAS1-shRNA1, ZFAS1-shRNA2) was evaluated by quantitative reverse transcription polymerase chain reaction. ZFAS1: ZNFX1-AS1. aP < 0.05; bP < 0.01.
- Citation: Zhuo ZL, Xian HP, Sun YJ, Long Y, Liu C, Liang B, Zhao XT. Long noncoding RNA ZNFX1-AS1 promotes the invasion and proliferation of gastric cancer cells by regulating LIN28 and CAPR1N1. World J Gastroenterol 2022; 28(34): 4973-4992
- URL: https://www.wjgnet.com/1007-9327/full/v28/i34/4973.htm
- DOI: https://dx.doi.org/10.3748/wjg.v28.i34.4973


