Copyright
©The Author(s) 2022.
World J Gastroenterol. Sep 14, 2022; 28(34): 4973-4992
Published online Sep 14, 2022. doi: 10.3748/wjg.v28.i34.4973
Published online Sep 14, 2022. doi: 10.3748/wjg.v28.i34.4973
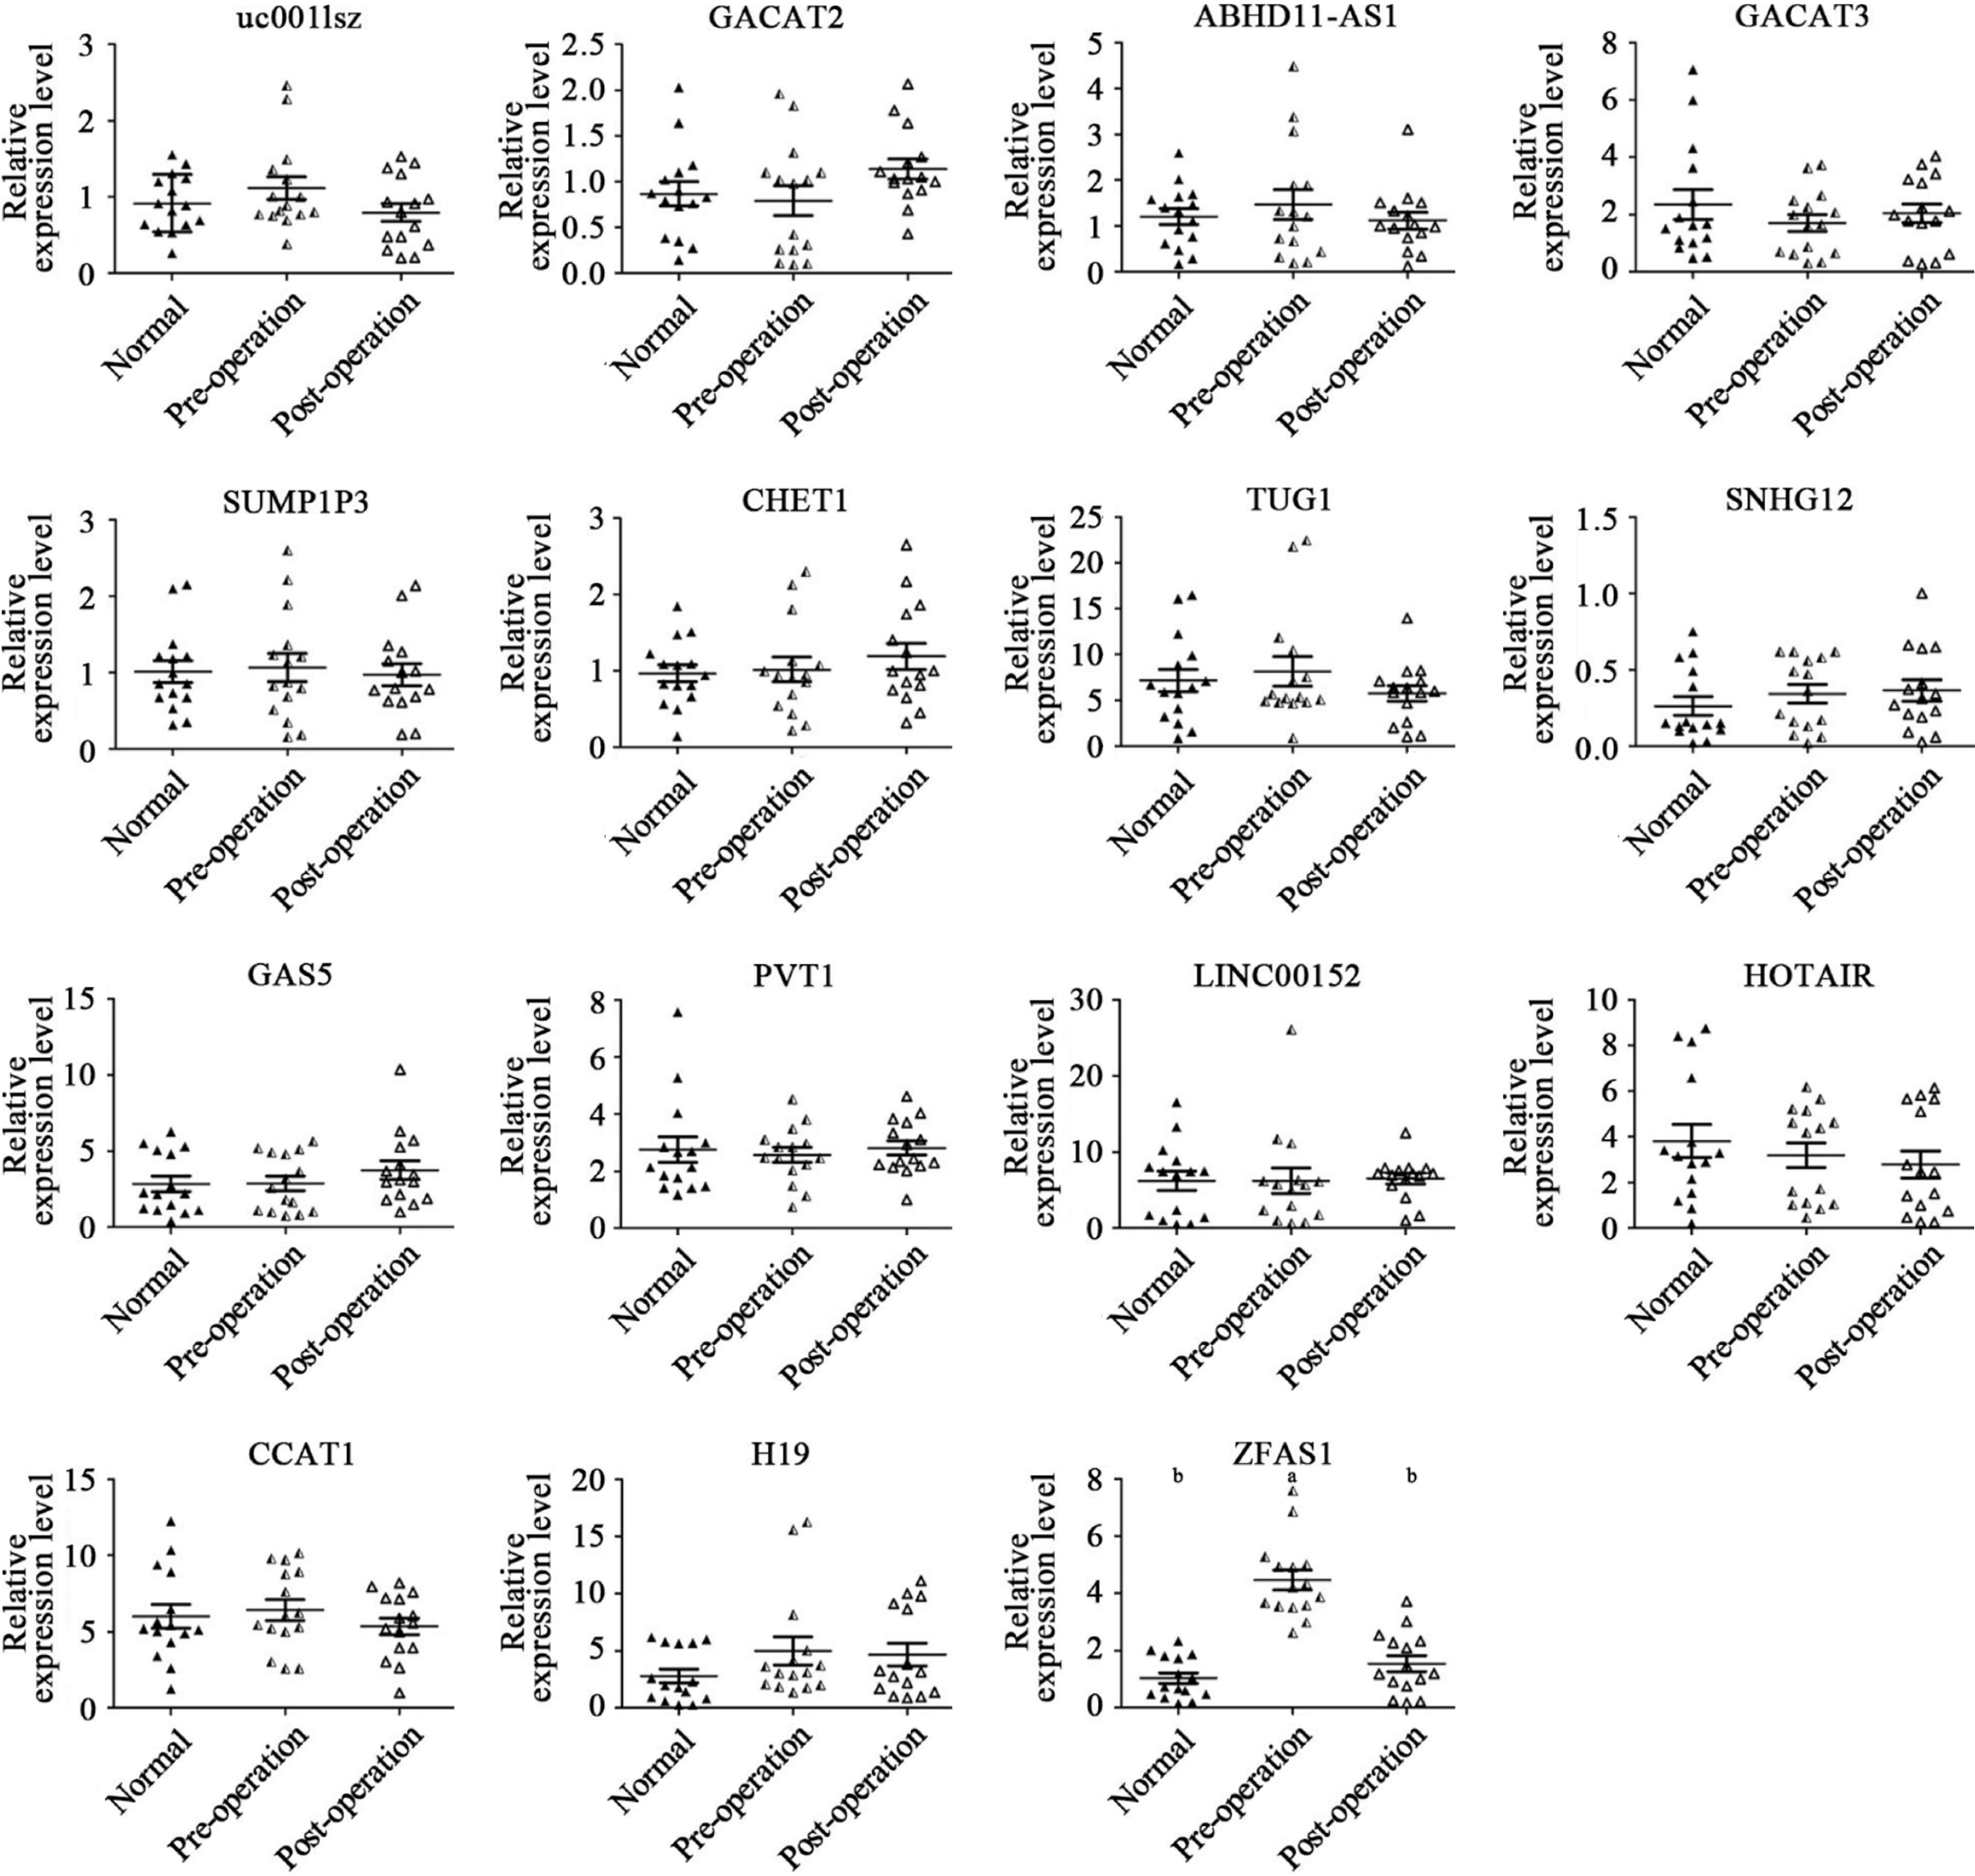
Figure 1 Relative expression levels of a selected subset of plasma long noncoding RNAs in 15 matched preoperative and postoperative gastric cancer patients and 15 healthy control subjects.
Scatter plot of long noncoding RNA relative expression levels in the plasma of preoperative patients (preoperative; n = 15), postoperative patients (postoperative; n = 15), and healthy control subjects (normal; n = 15), as assessed by quantitative polymerase chain reaction. The upper and lower bars indicate the ± SD values, and the middle bar indicates the median value. P values (aP < 0.05; bP < 0.01) were determined using the t-test.
- Citation: Zhuo ZL, Xian HP, Sun YJ, Long Y, Liu C, Liang B, Zhao XT. Long noncoding RNA ZNFX1-AS1 promotes the invasion and proliferation of gastric cancer cells by regulating LIN28 and CAPR1N1. World J Gastroenterol 2022; 28(34): 4973-4992
- URL: https://www.wjgnet.com/1007-9327/full/v28/i34/4973.htm
- DOI: https://dx.doi.org/10.3748/wjg.v28.i34.4973


