Copyright
©The Author(s) 2022.
World J Gastroenterol. Aug 28, 2022; 28(32): 4681-4697
Published online Aug 28, 2022. doi: 10.3748/wjg.v28.i32.4681
Published online Aug 28, 2022. doi: 10.3748/wjg.v28.i32.4681
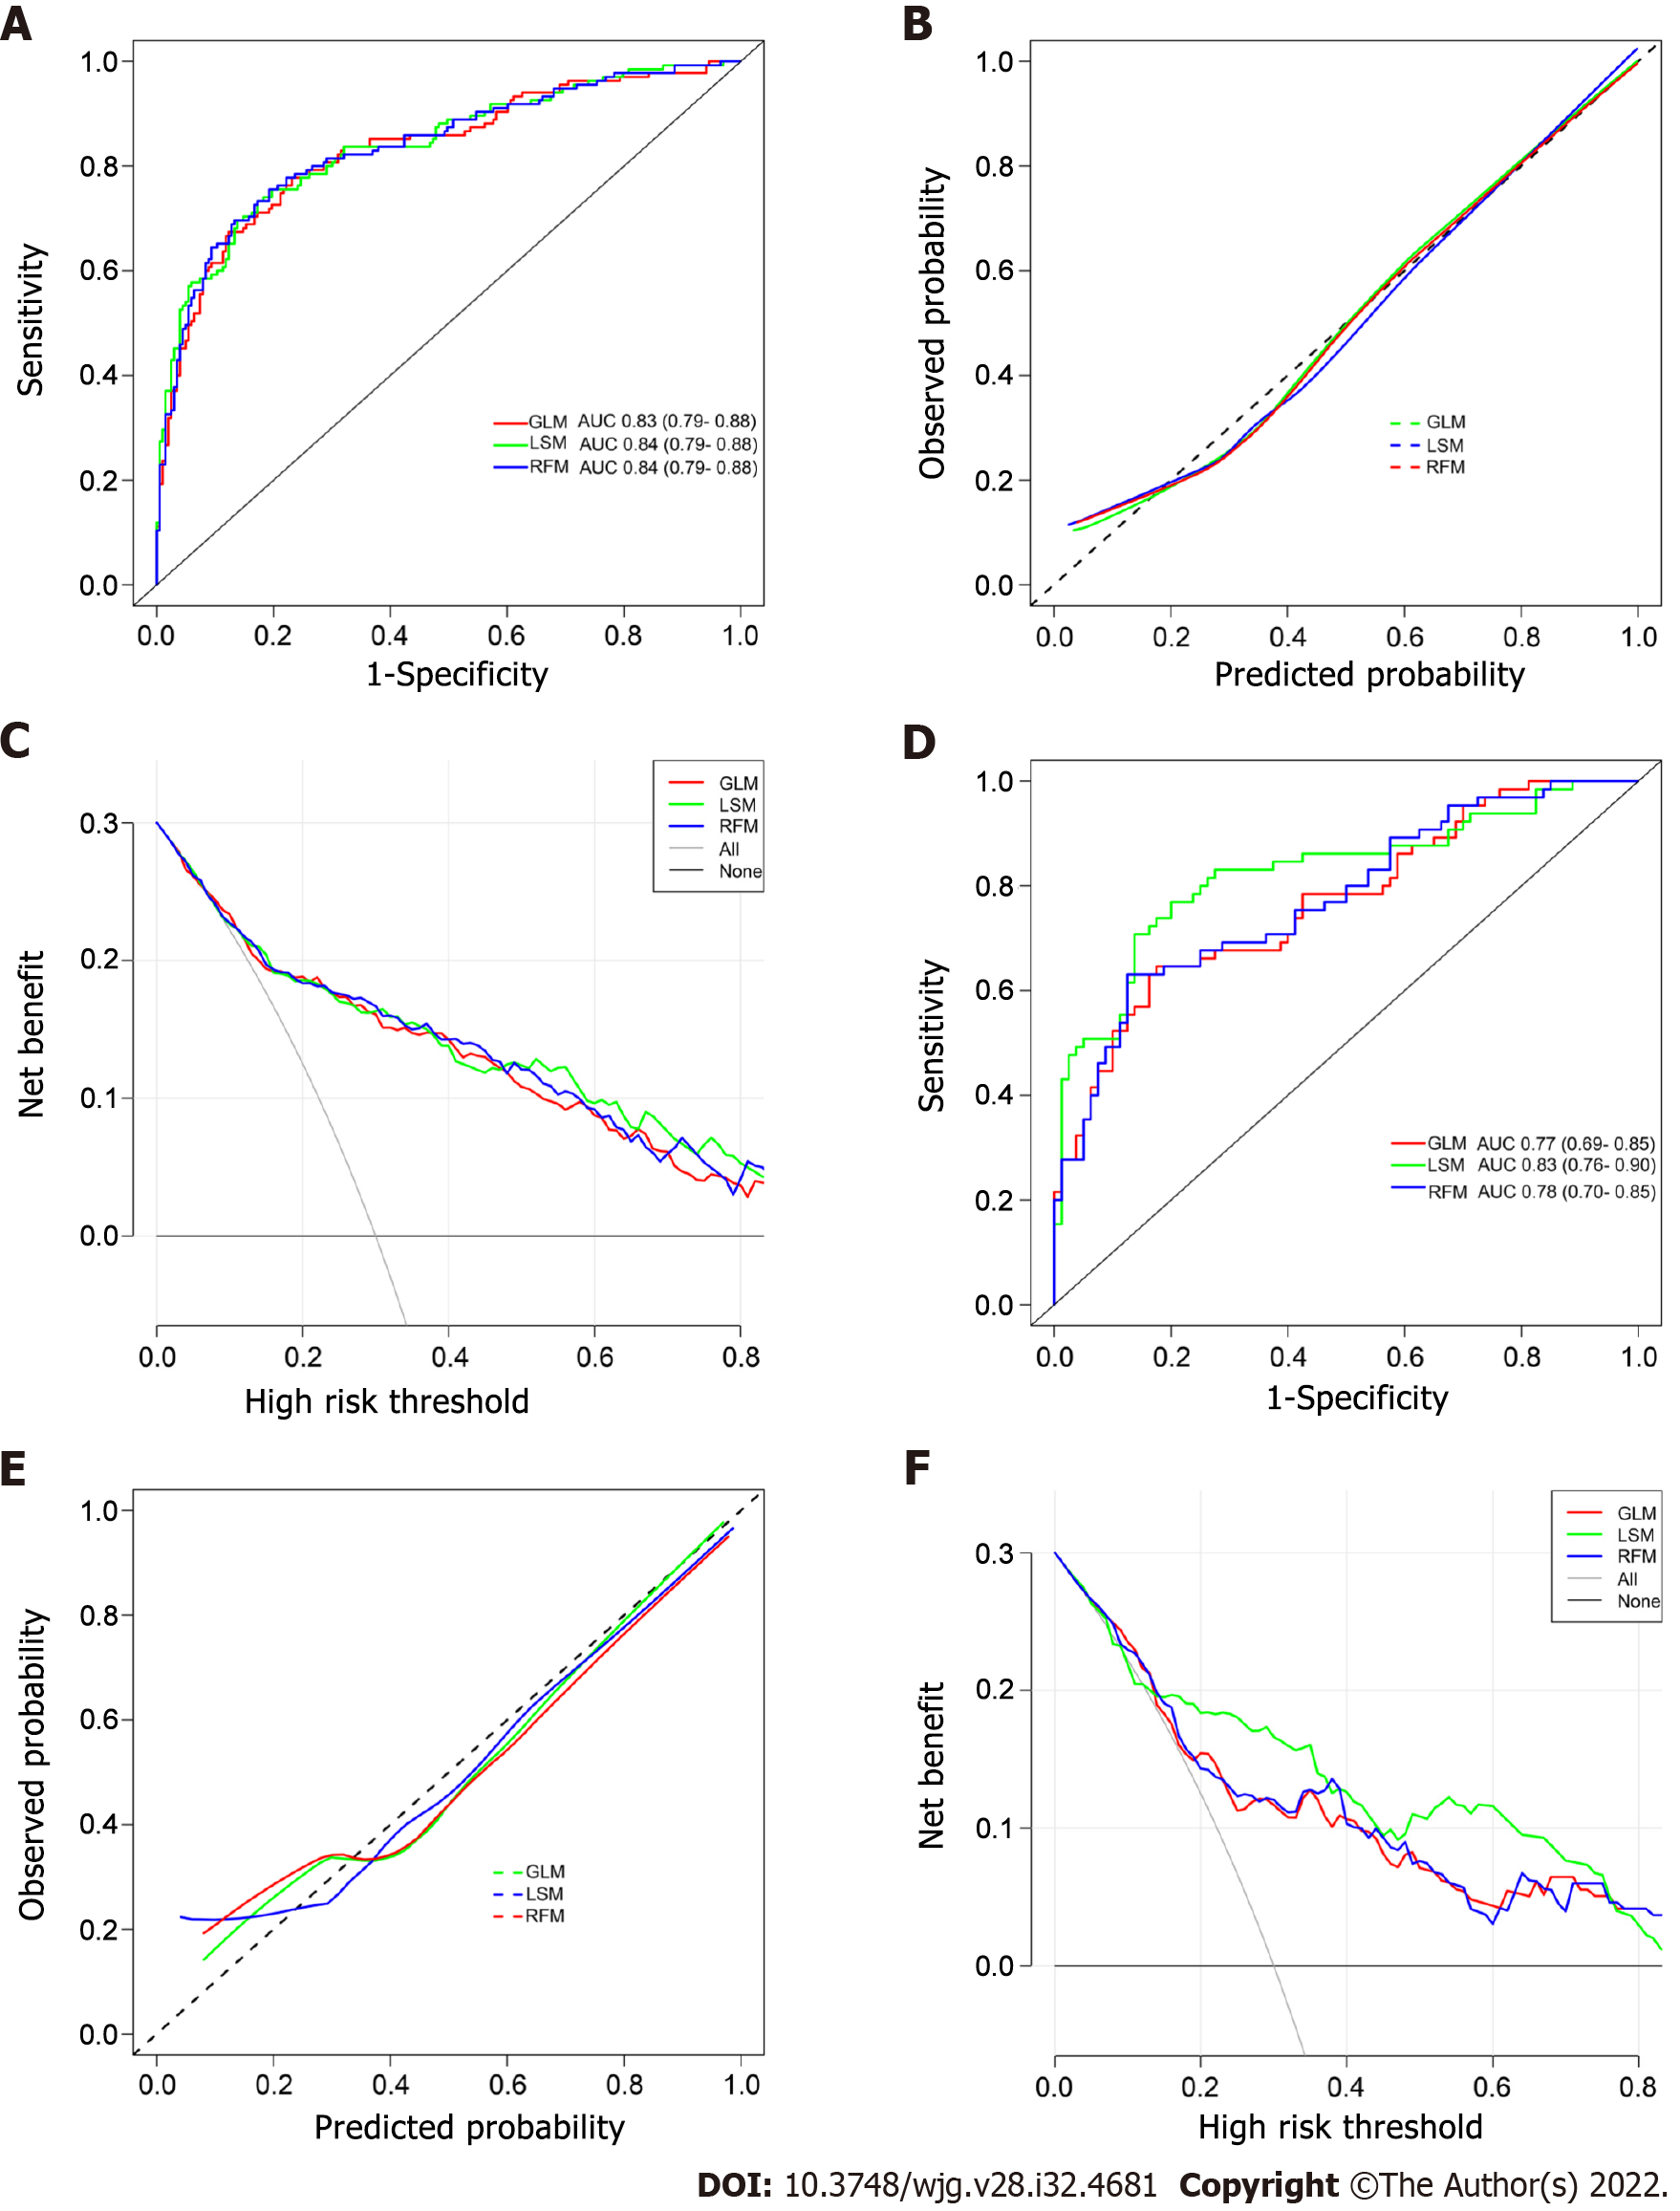
Figure 3 Evaluation and validation of the postoperative platelet elevation rate-based models in the training cohort and validation cohort.
A and D: The receiver operating characteristic curves of the postoperative platelet elevation rate (PPER)-based models; B and E: The calibration curves of the PPER-based models; C and F: The decision curve analysis of the PPER-based models. GLM: Generalized linear model; LSM: Least absolute shrinkage and selection operator model; RFM: Random forest model; AUC: Area under the receiver operating characteristic curve.
- Citation: Li J, Wu QQ, Zhu RH, Lv X, Wang WQ, Wang JL, Liang BY, Huang ZY, Zhang EL. Machine learning predicts portal vein thrombosis after splenectomy in patients with portal hypertension: Comparative analysis of three practical models. World J Gastroenterol 2022; 28(32): 4681-4697
- URL: https://www.wjgnet.com/1007-9327/full/v28/i32/4681.htm
- DOI: https://dx.doi.org/10.3748/wjg.v28.i32.4681


