Copyright
©The Author(s) 2022.
World J Gastroenterol. Aug 28, 2022; 28(32): 4681-4697
Published online Aug 28, 2022. doi: 10.3748/wjg.v28.i32.4681
Published online Aug 28, 2022. doi: 10.3748/wjg.v28.i32.4681
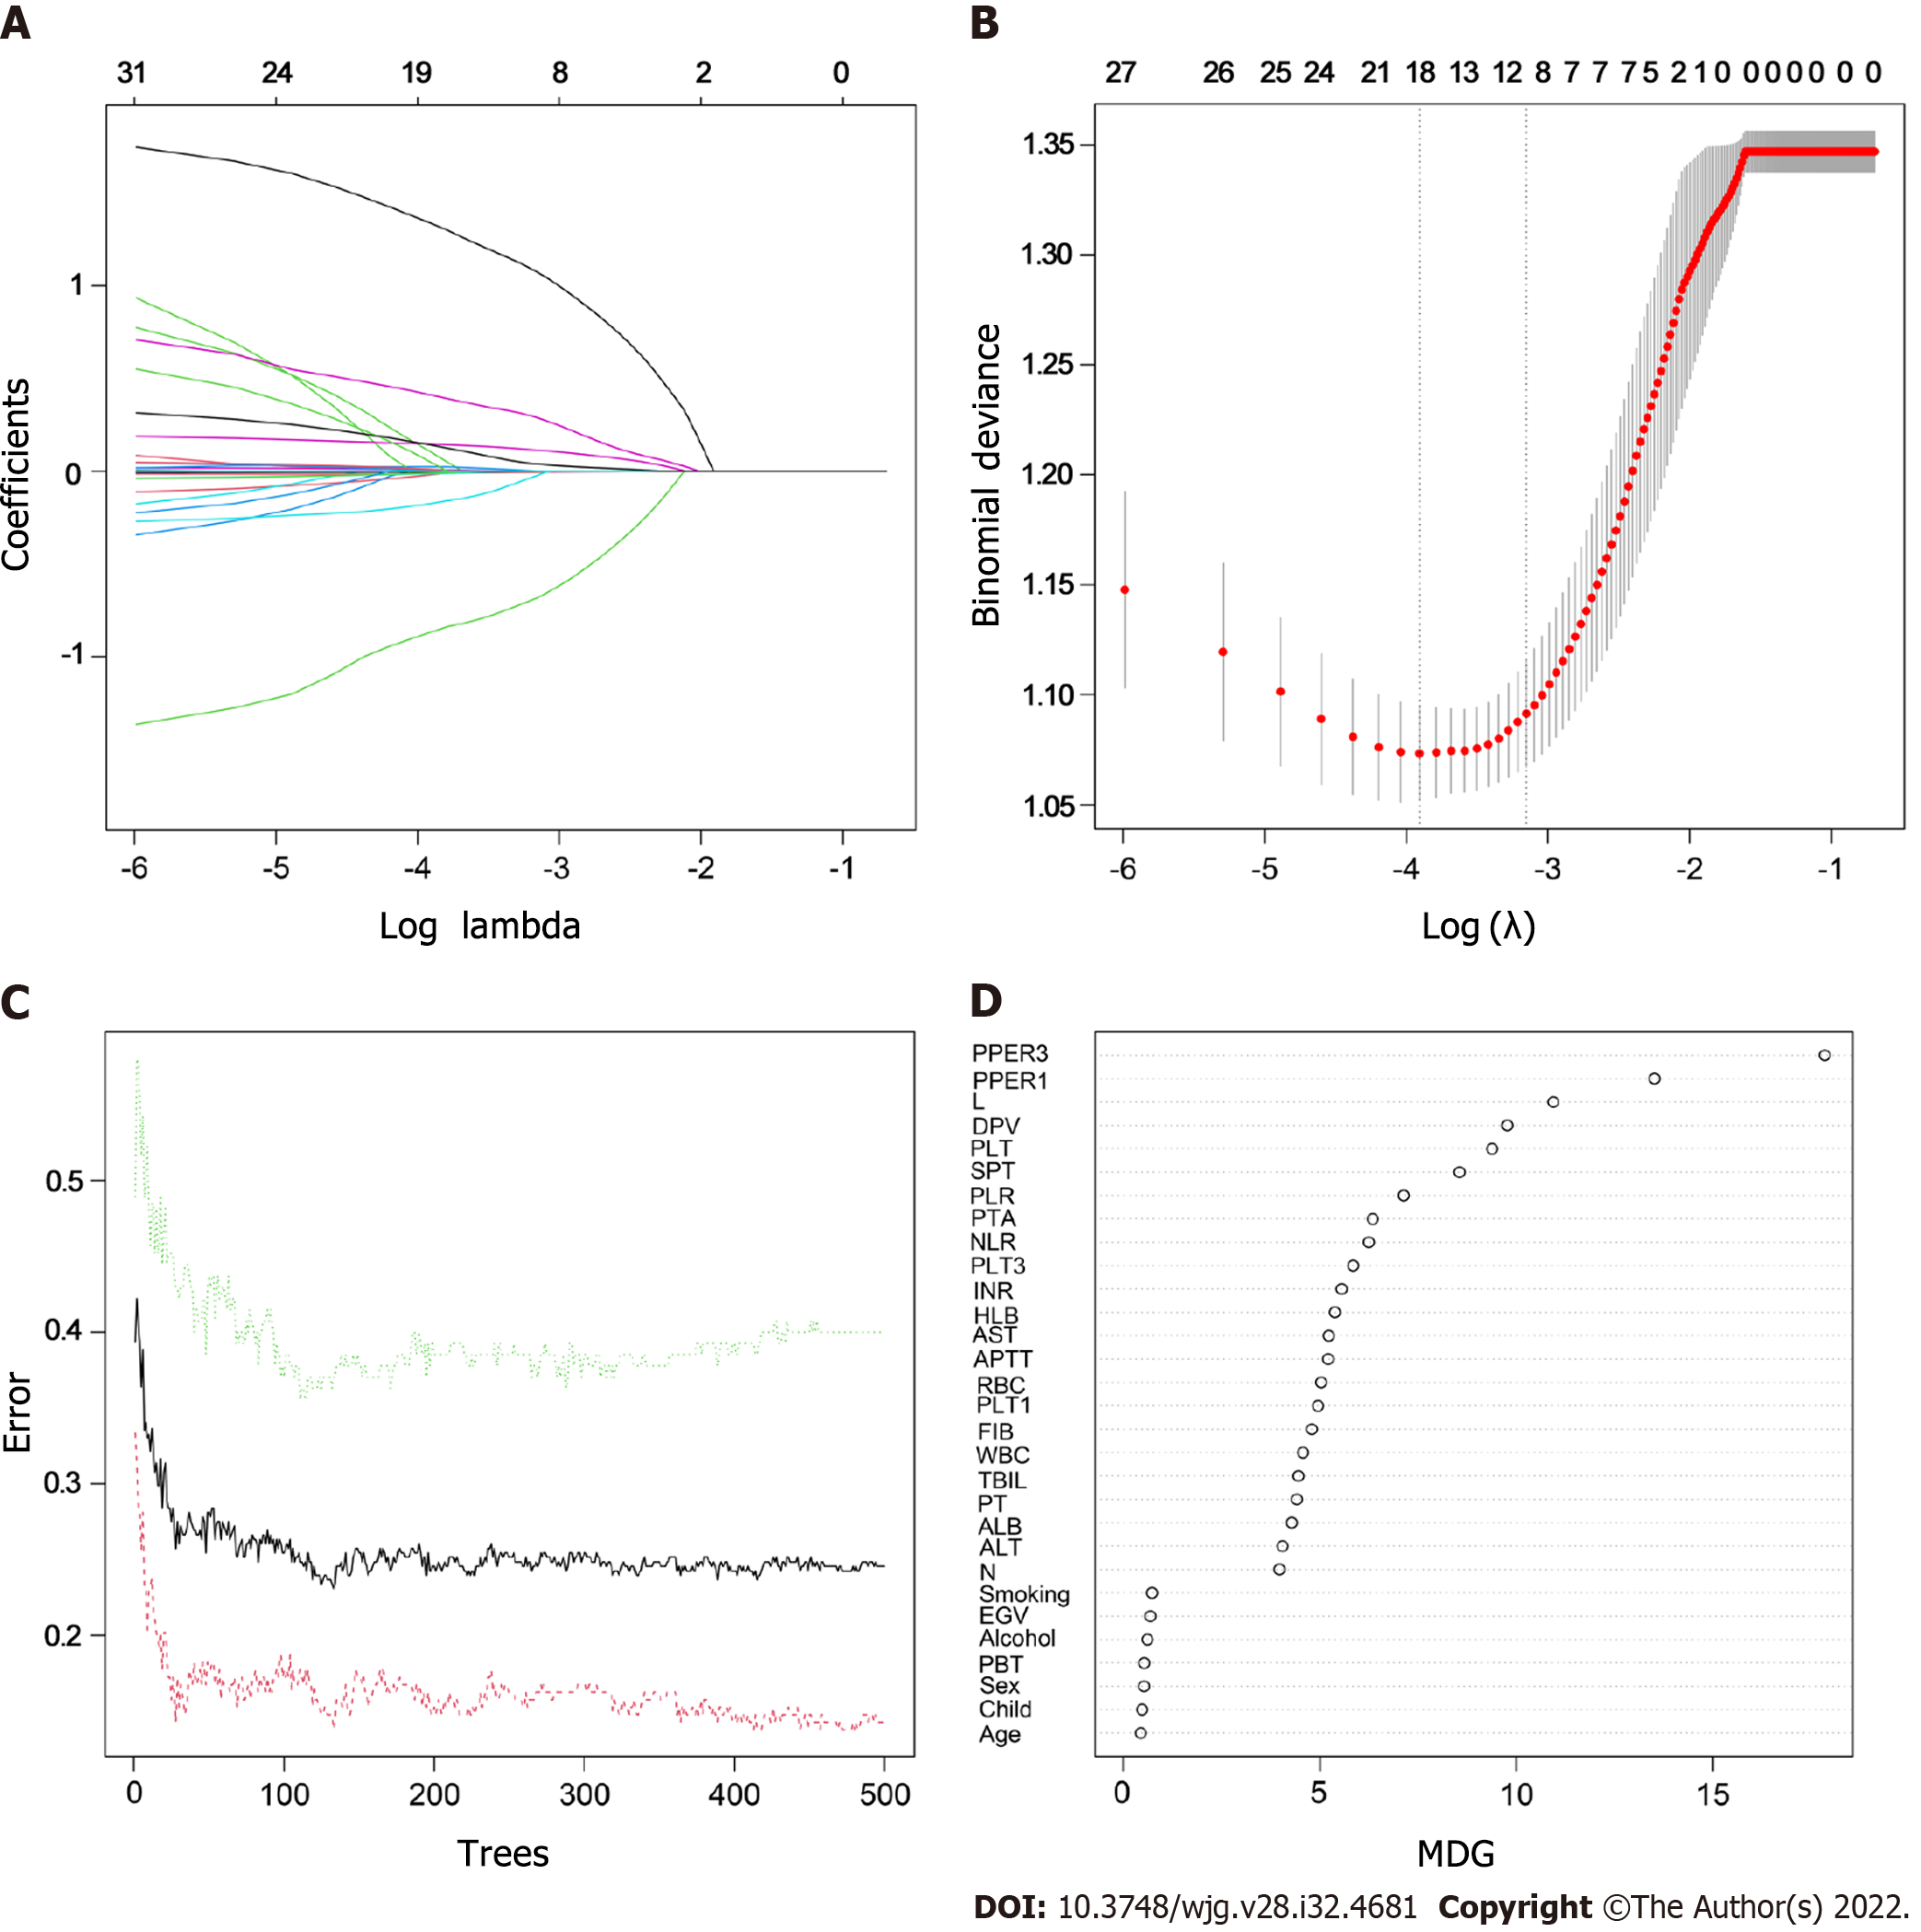
Figure 2 Features selection.
A: Least absolute shrinkage and selection operator variable trace profiles of the 31 features. The 3-fold cross-validation was employed; B: Mean square error (MSE) plots of models under different lambda. The lambda corresponding to one MSE away from the minimum MSE was the optimal lambda value of 0.043, and the target variables shrunk to 10; C: Relationships between the error and number of trees. There are three lines, green representing error in the positive event group, red representing error in the negative event group, and black representing error in the total sample group; D: Importance scores of the candidate features. RBC: Red blood cells; HLB: Hemoglobin; WBC: White blood cells; N: Neutrophil count; L: Lymphocyte count; NLR: Neutrophil to lymphocyte ratio; PLT: Platelet count; PLR: Platelet to lymphocyte ratio; PT: Prothrombin time; PTA: Prothrombin activity; INR: International normalized ratio; FIB: Fibrinogen; APTT: Activated partial thromboplastin time; ALT: Alanine aminotransaminase; AST: Aspartate aminotransaminase; ALB: Serum albumin; TBIL: Total serum bilirubin; Child: Child-Pugh grade; EGV: Esophageal and gastric varices; SPT: Spleen thickness; DPV: Diameter of the portal vein; PBT: Preoperative blood transfusion; PLT1: Platelet count at postoperative day 1; PLT3: Platelet count at postoperative day 3; PPER1: Platelet elevation rate at postoperative day 1; PPER3: Platelet elevation rate at postoperative day 3; MDG: Mean decreased Gini.
- Citation: Li J, Wu QQ, Zhu RH, Lv X, Wang WQ, Wang JL, Liang BY, Huang ZY, Zhang EL. Machine learning predicts portal vein thrombosis after splenectomy in patients with portal hypertension: Comparative analysis of three practical models. World J Gastroenterol 2022; 28(32): 4681-4697
- URL: https://www.wjgnet.com/1007-9327/full/v28/i32/4681.htm
- DOI: https://dx.doi.org/10.3748/wjg.v28.i32.4681


